Table of content
It goes without saying that there are hundreds of different Forex trading strategies, some of them focus on scalping or other types of short term trading, while others are more suited for the long term trading.
However, it is important to keep in mind that regardless of the technique, none of them can guarantee a 100% success rate. So essentially, Forex trading strategies are designed to simply improve the odds in favor of traders, rather than ensuring payouts all the time.
At the same time, there are many risk averse traders, who want to use methods, which can reduce the risk of financial losses down to a minimum. One of the most common ways to achieve this goal is to use Forex hedging strategies. This essentially involves opening positions in a way to minimize the amount of the potential losses regardless of the market circumstances.
Here it is worth noting that there is not a single universally accepted hedging strategy which is used by all of the traders. Instead, there are dozens of different hedging techniques, while some of them are more complicated than others. Therefore, some beginners in the Forex market might decide that hedging strategies are too difficult for them to understand and avoid using them.
Fortunately, there is a very simple Forex hedging strategy, which is relatively easy to understand and implement. This is known as the Forex correlation hedging strategy. It essentially involves opening of the opposite positions with highly positively correlated currencies.
The main idea here is that the positively correlated currencies tend to move in the same direction. Therefore, when traders use the Forex correlation hedging strategy, the losses with one currency pair is likely to be offset by the gain with the second position.
In addition to that, traders can also utilize the highly negatively correlated currencies for hedging strategies. This involves opening long or short positions with two strongly negatively correlated currency pairs. The fact of the matter is that those types of currency pairs tend to move in the opposite directions. Consequently, just like in the previous case, the losses with one pair are likely to be neutralized by the gains with another one.
Finally, it is important to keep in mind that despite all of the advantages of correlation hedging strategies, there is no guarantee that they will always be effective. The reality of the matter is that due to various economic reasons, there can be some periods of divergence between highly correlated currencies, which can disrupt normal trading patterns.
Now, let us go through the characteristics of the Forex correlation hedging strategy in more detail.
Correlation Coefficient
When it comes to Forex trading, every currency pair has some degree of positive or negative correlation with other currency pairs. In order to simplify their analysis, the market participants are using so-called the correlation coefficient. This indicator can range from -1.00 to 1.00.
If the correlation coefficient is at -1.00, then it means that two given currency pairs are perfectly negatively correlated with each other. If the indicator shows 0, then this suggests that two pairs have no positive or negative correlation whatsoever. Finally, the correlation coefficient of 1.00 means that two currency pairs have a perfect positive correlation.
Obviously, the cases of perfect positive or negative correlation are very rare indeed. Nearly in all of the cases, the correlation coefficient lies between those two extremes.
In order to better illustrate the relationship between different currency pairs, we can take a look at this diagram, which shows the correlation coefficient for different currency pairs in relation to the GBP/USD pair:
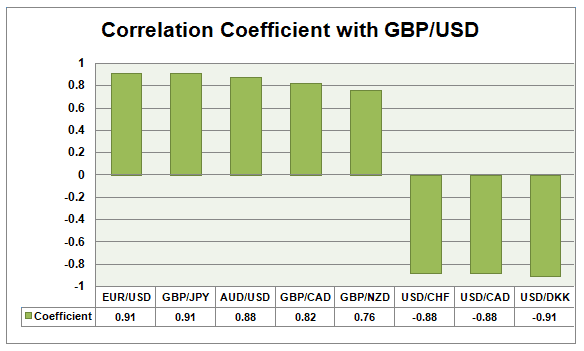
As we can see from the above chart, the correlation coefficient of GBP/USD pair with GBP/JPY and EUR/USD pairs is 0.91. This suggests that there is a strong degree of correlation between those currency pairs. In addition to that, the above diagram also shows that the GBP/USD pair also has a strong correlation with other currency pairs such as AUD/USD, GBP/CAD, and GBP/NZD.
On the other hand, the GBP/USD pair has a strong negative correlation with USD/CHF, USD/CAD, and USD/DKK. For example, the correlation coefficient between GBP/USD and USD/CAD is at -0.88, which is points to the fact that in most cases, those two pairs generally tend to move in opposite directions.
Example of Positively Correlated Currency Pairs
One of the simplest ways to use the hedging strategy is to take the opposite position with two highly positively correlated currency pairs. In order to understand this better, we can compare two charts. The first daily diagram shows the exchange rate of /USD during the last 3 years:
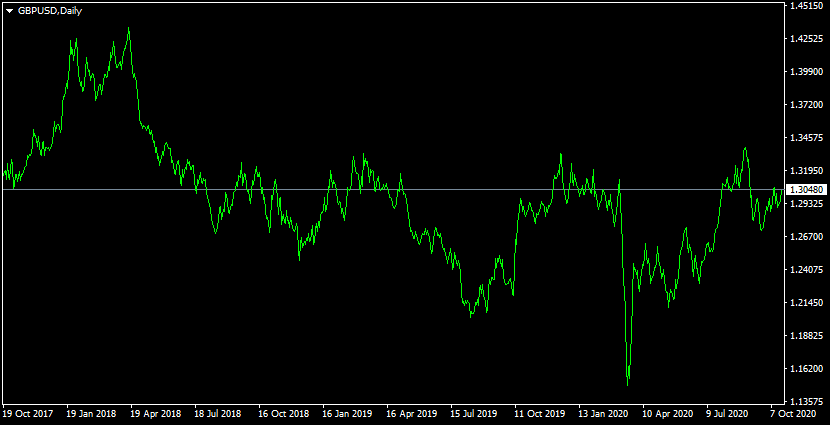
As we can see from the above diagram, back in October 2017, the British currency was trading close to the $1.31 level. During the subsequent months, the pound has made some notable gains and advanced all the way up to the $1.43 level during the early Spring 2018.
However, despite those impressive gains, this upward trend for the pound did not persist for long. In fact, during the following months, the British currency has suffered steady losses. This depreciation has gathered more steam in the aftermath of the outbreak of the COVID-19 pandemic. As a result, by the middle of March 2020, the GBP/USD pair has dropped all the way down to the $1.15 level.
Regardless of those developments, during the subsequent period the British pound has recovered from this sharp depreciation and by October 2020 has returned back to the $1.30 level.
Now, let us compare this to the most liquid currency pair in the Forex market, EUR/USD. The chart below depicts the price movements of this pair during the same period:

As the above diagram demonstrates, 3 years ago, the Euro was trading near the $1.18 level. From late 2017 until Spring 2018, the single currency has made some notable gains, eventually rising all the way up to the $1.25 mark against the dollar, a level not seen in 6 years.
However, those gains turned out to be short-lived, as the US dollar started to recover and regain some of its recent losses. Actually, this new downward trend for the EUR/USD pair has persisted for two years. Just like in the case of the GBP/USD pair, the initial reaction to the market in response to the outbreak of the COVID-19 pandemic was a flight to safety and consequently, a sharp appreciation of the US dollar.
As a result of those developments, by March 2020, the Euro has dropped all the way down to the $1.06 level. However, it is worth remembering that by that time the US Federal Reserve has cut its federal funds rate down to 0% to 0.25% range. The fact of the matter is that as early as during the first half of 2019, the key official interest rates in the US were at 2.5%. Consequently, it is not surprising that such sharp interest rate cuts have negated any advantage the USD had over the higher rates and had a negative impact on the value of the US dollar.
In response to those events, the Euro began to recover and by October 2020, had returned to the $1.18 level, erasing all of its recent losses in the process.
So as we can see from this example, the high degree of positive correlation of the GBP/USD and EUR/USD pairs is not only apparent from the correlation coefficient, but also from the above charts as well.
The fact of the matter is that as both of the diagrams demonstrate, those two pairs have gone through the same three stages. Firstly, from Fall 2017 until the early Spring 2018, the Euro and pound have made some steady gains against the dollar, eventually reaching the multi-year highs in the process.
During the second stage, from the late Spring 2018 until March 2020, there was a major reversal, where the US dollar has managed to gain some strength and as a result, bring EUR/USD and GBP/USD pairs down to multi-year lows.
Finally, we have seen the recovery of the Euro and pound from April until October in 2020, where those currencies have managed to erase all of their recent losses as a result of their appreciation.
Obviously, this does not mean that EUR/USD and GBP/USD pairs represent the case of the perfect correlation. After all their correlation coefficient is at 0.91. This suggests that there is indeed a case of strong correlation, but it still is not perfect. In other words, in some cases, those currency pairs still diverge from each other. However, still, this does not change the fact that they generally tend to move in the same directions, with some rare exceptions.
Utilizing Hedging Strategies with the Positively Correlated Currency Pairs
Here it is worth mentioning that the main idea for hedging strategy is to open positions in a way to minimize the potential losses regardless of the circumstances in the market. So returning to our example, one way to achieve this would be to open a long position for the EUR/USD pair and a short position for the GBP/USD pair. Alternatively, one can sell the EUR/USD pair and buy the GBP/USD pair.
Due to the high degree of the positive correlation between those two pairs, in both cases, it is highly likely that losses with one currency pair will more than likely be compensated by gains with another currency pair.
For example, let us suppose that some traders decide to open a long EUR/USD and short GBP/USD positions, using the hedging strategy. If the EUR/USD falls, then the strength of the US dollar is likely to push GBP/USD lower as well. Therefore, the losses that traders suffered from the long EUR/USD position is likely to be compensated by the gains they make with the GBP/USD pair.
So employing this type of hedging strategy does not require an advanced knowledge of economics or Forex trading. All traders have to do is to take a look at the correlation coefficients of different currency pairs and select the ones which have a coefficient of 0.75 or higher. Then they can open one long and one short position with each of those pairs. So as we can see the process here is quite straightforward.
Using Correlation Hedging Strategies with Negatively Correlated Pairs
At this stage, it is important to point out that the positively correlated currency pairs are not the only ones which traders can utilize for their hedging strategies. In fact, the market participants can do this with the negatively correlated currency pairs as well. In order to get a better idea about the real life examples of those types of currencies which can take a look at the daily USD/CAD chart:
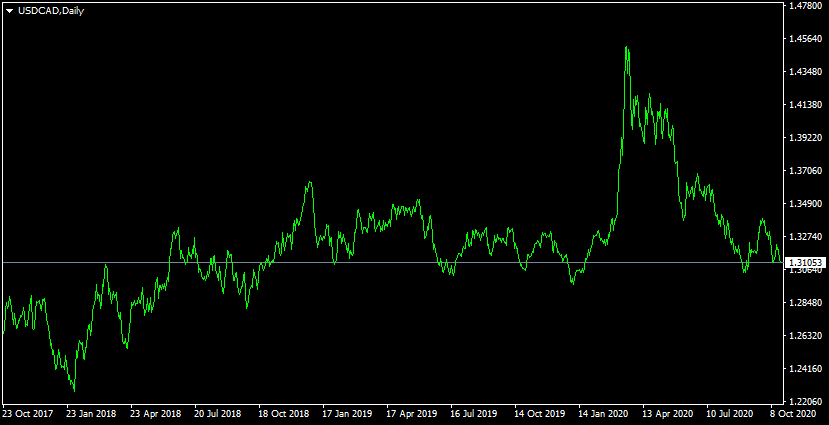
As we can observe from the above diagram, 3 years ago, the USD/CAD pair was trading close to the $1.26 level. Due to the rise in the oil price as well as some other factors the Canadian dollar has made some notable gains during the late 2017 and early 2018.
However, since Spring 2018 the tide has turned in favor of the US dollar, with the American currency making some steady gains during the subsequent two years. During the first quarter of 2020, the oil price collapsed, at one point even going negative in the process. This trend has only accelerated the depreciation of the Canadian dollar, with the USD/CAD pair reaching $1.45 in March 2020.
However, from May 2020 the oil price started to recover, until reaching the $40 level. It is not surprising that this had a very positive impact on the Canadian dollar, which has made some gains during the subsequent months. As a result, by October 2020 the USD/CAD pair has dropped to the $1.31 level.
As we can see here, the USD/CAD pair has also gone through 3 stages during the same period, however, it represented an inversion of EUR/USD and GBP/USD. This is not surprising, since the correlation coefficient between the USD/CAD and the GBP/USD is -0.88. This suggests that there is a strong negative correlation between those currency pairs.
Therefore, traders can use correlation hedging strategy by opening the following positions:
- Buy EUR/USD, Sell USD/CAD
- Buy GBP/USD, Sell USD/CAD
- Sell EUR/USD, Buy USD/CAD
- Sell GBP/USD, Buy USD/CAD
- Buy EUR/USD, Sell GBP/USD
- Sell EUR/USD, Sell GBP/USD
So as we can see here there are 6 different ways to open positions in a way to hedge against possible market volatility. In each case, the positions are arranged in a way that the losses with one pair are more than likely to be compensated by the gains with another.
Imperfections of the Forex Correlation Hedging Strategy
Despite all of the usefulness and advantages of using the Forex correlation hedging strategies, it is important to mention that just like any other technique in trading they can not always guarantee a success.
The fact that this method utilizes highly correlated currency pairs, does mean that traders are likely to succeed with this strategy. However, the reality of the matter is that from time to time, there are indeed cases of divergence between those pairs. Different economic and political events have the ability to disrupt the common patterns in the market.
One obvious example of this is the case of AUD/USD and gold price. For more than a decade, there was a strong positive correlation between those two securities. The main reason behind this is the fact that Australia is one of the largest exporters and producers of gold in the world.
Consequently, when the price of precious metals rises, it generally tends to increase revenues of Australian mining companies, which in turn can certainly help their profitability, as well as boost their hiring potential as well. In addition to that, the Australian government has more tax revenues to work with due to the rising profitability of those firms.
On the other hand, the opposite is also true. When the gold price declines, it also reduces the revenues received by the Australian mining companies. This obviously has a very negative impact on their profitability.
It is also likely that faced with declining revenues, those firms might decide to reduce the size of their workforce as well, increasing the unemployment rate in the country in the process. Also, this process presents the Australian government with a serious challenge, since the tax revenues are declining and yet, they have to pay out more in unemployment benefits.
So obviously, the majority of traders are not oblivious to this situation, so when the gold price rises, it tends to benefit the exchange rates of the Australian dollar. On the other hand, when the prices of precious metals fall, traders tend to sell AUD, obviously leading to its depreciation.
However, despite this relationship, from the second half of 2019, until Spring 2020, this relationship was disrupted and there was a significant amount of divergence between the gold price and the value of the Australian dollar.
The fact of the matter was that faced with the rate cuts of the US Federal Reserve, the real interest rates in the US have once more crossed into the negative territory. This made the gold and silver investments attractive to some investors since there are many market participants who perceive them as a reliable store of value. As a result, the gold price has made some steady gains and eventually has even overcome 2011 all-time highs, reaching the $2,000 level in the process.
So, logically speaking, the Australian dollar should have benefited from those latest trends. However, in reality, this turned out not to be the case. Instead, the Australian dollar kept its long term depreciation against the US dollar, the Euro, and other major currencies, until reaching multi-year lows by March 2020. It was only from April when the Australian dollar began its recovery and once more started following the gold price movements.
The reason behind this disruption was the fact that during this period, the Reserve Bank of Australia has started cutting rates, until reducing them to 0.25%. This obviously made the Australian dollar less attractive to savers, traders, and investors, leading to its depreciation against the US dollar and the other major currencies. However, once the Reserve Bank of Australia has ended its rate cut cycle, this allowed the Australian currency to recover.
Therefore, as we can see from this example, there can be cases when the normal trading patterns might be disrupted because of interest rate changes, economic indicators for various other reasons. Therefore, traders should not only rely on the correlation coefficient when making trading decisions and formulating their hedging strategies. Instead, it is much better to take into account different types of fundamental and technical indicators, before opening any positions.