Table of content
Moving average indicator is one of the most important and popular technical indicators in Forex trading. It helps traders to filter out all of the daily noise of market movements and observe the latest trends in the currency pairs. The moving average formula is quite simple: this indicator is calculated by the average closing price of the security within a specified period of time.
Here it is worth mentioning that there are two main types of moving averages: simple moving average (SMA) and exponential moving average (EMA). The key difference between those two measures is that the latter one gives greater weight for the latest closing prices, while the SMA treats all prices within the same timeframe equally.
When it comes to the exact number of periods, measured by those indicators, it is important to note that there is no one universally accepted moving average method. Instead, each trader and financial analyst does have his or her own preferences.
However, there are some popular methods to approach this. For example, for many market participants 20-day simple moving average is an important indicator for short term trends. At the same time, a 50-day simple moving average is more popular for identifying the medium trend direction of the market. Finally, many experienced professional traders believe that the 200-day simple moving average indicator to be an important long term indicator for the Forex market.
Many market participants use moving average forecasting the future movements in the market. The general consensus here is that as long as a simple moving average moves higher then the given currency pair should be in an upward trend. The opposite is also true: downward pointing moving average indicator most often is a sign that the pair is in a downtrend.
It is also important to mention that moving average crossover can be an important signal for a trend change. The fact of the matter is that many traders and analysts use several simple or exponential moving averages together. For example, some people might use 20-day SMA in conjunction with 50-day SMA, or any other variation of those indicators.
The general rule of thumb here is that when a shorter term simple moving average indicator crosses below the longer term SMA, it is a very bearish sign and can point to the beginning of the downward trend. On the other hand, if the shorter term SMA breaks above the longer term SMA, it can be a very bullish indicator and can be a notable sign of a new uptrend.
Moving Average in Forex Trading
A moving average can provide traders with a valuable visual aid when it comes to chart analysis and trend determination. In fact, this is a very good indicator that can be very handy especially for those individuals who do not yet have a great deal of experience in Forex trading. Here is worth noting that sometimes the price action can be very volatile and confusing. Therefore it becomes very difficult to tell where the exchange rate is heading and whether the given currency pair is engaged in some kind of trend.
So here they might call this indicator a moving average filter because it takes all of the unnecessary noise out of the equation and leaves market participants with a much clearer picture of the latest market trends. Therefore, with greater clarity at hand, traders are more likely to come up with more accurate analysis and also are likely to improve their overall trading results.

Obviously, there are some specialists, who prefer to use moving average excel spreadsheets. At the same time, some people might also work with moving average in the Python program. However, nowadays for many people, it is much simpler and preferable to analyze those indicators using trading platforms, which is widely available online.
In order to illustrate how do the moving averages work, let us take a look at this daily GBP/USD chart with a 20-day simple moving average, indicated by the red line:
As we can see from the above diagram, the 20-day SMA indicator very often can be a valuable indicator for determining the short term trends. For example, at the very beginning of the chart, we can see that the price action of the GBP/USD pair was mostly confined within the 1.24 to 1.25 range. At this stage, it was not at all clear that the pair would eventually break above or below those levels. In fact, we have many examples, where this type of consolidation has even persisted for several months with some currency pairs.
However, as the diagram shows, even before the pair broke below the range, the 20-day simple moving average was moving lower and therefore was pointing downwards. This means that at least a week before the GBP/USD started to decline, the 20-day SMA was already predicting this move.
If we observe the chart in more detail, we can notice that this indicator has also predicted the end of running trends as well. For example, after bottoming out near the 1.20 level, the GBP/USD pair had recovered and rallied during late August 2019. However, shortly after this move, there were 4 red candles in a row and it seemed most likely that the recent rally represented something of a dead cat bounce and the pair would simply resume its downward trend. However, during the same time, the 20-day simple moving average stayed mostly flat, even at some points slightly moving upward. This signaled an end to the recent downtrend.
Sure enough, the pair soon reversed course and the pound has made steady gains during the next several months, eventually going all the way up to 1.34 level. However, at this stage, the pair has stagnated. In fact, at least at 6 instances, the pound tried to break above the recent range. It seemed like the GBP/USD would overcome resistance levels and break above the resistance levels.
However, most of the time, the 20-day simple moving average was moving downwards. So, after 6 failed attempts for a breakout, the GBP/USD pair has fallen down significantly, eventually dropping all the way down to 1.15 level. Despite this setback, the pair did manage to regain some of its losses and stabilize around the 1.25 level.
So as we can see from the above example, the 20-day simple moving average can provide traders with the early warning signal for an end to the current trend or alternatively, the beginning of new uptrend or a downtrend.
How to Use Moving Average in Forex Trading
It goes without saying a 20-day simple moving average can be a handy tool for Forex traders. However, it is worth mentioning that it is not the only popular indicator, used by professional traders. As mentioned before, a 50-day simple moving average can be a helpful indicator for medium term trends, while 200-day SMA might serve as an important measure for long term exchange rate movements.
To illustrate this better, let us take a look at this daily GBP/USD chart:
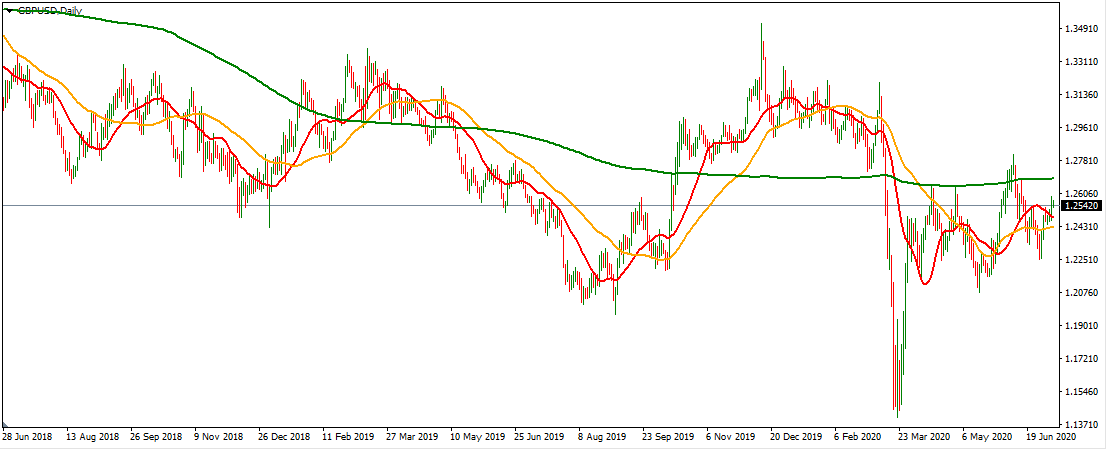
As we can see from this image, the timeframe here is expanded in order to better illustrate the differences between those three 3 different indicators. Just like in the previous chart a red line denotes the 20-day simple moving average. At the same time, the orange line represents the 50-day SMA, and the green line shows the 200-day SMA.
As we can see from the chart above, the 200-day simple moving average was moving lower from June 2018, until December 2019. This suggested that the pair was in a long term downward trend. Then the line flattened, which might be a sign of consolidation. In general, it is evident that the green line is rather slow moving and is most informative of long term developments, rather than short or medium term trends.
It goes without saying that the orange line, which represents the 50-day simple moving average is much more mobile and experienced some significant movements. In fact, at the beginning of this diagram, the pair did try to rally during some weeks and the red line crossed over the orange line.
For some traders, this might have been a major bullish sign. However, here it is important to note that the orange line still remained flat or moving downward most of the time. This suggested that we were dealing with a false breakout. This prediction actually turned out to be true and the exchange rate moved much lower, with its 20-day simple moving average indicator.
Another important development in this chart was the crossing of the 50-day simple moving average over the 200-day simple moving average. In the Forex analysis, this can be a major sign of trend change. In fact, they even have some names assigned to them. When a 50-day simple moving average breaks below the 200-day SMA, it is known as the ‘Death Cross’ and is generally believed to be a very bearish sign for the given currency pair.
On the other hand, when the 50-day SMA breaks above the 200-day simple moving average, then it is called ‘Golden Cross’ and is considered to be an important bullish indicator for the security.
As we can see from the chart above, each of these scenarios has happened 2 times. In each case, the pair were engaged in several months’ worth of respective uptrends and downtrends.
A proper moving average Forex strategy also should take into account the fact that not only when the 50-day SMA, but also when the current market price crosses the long term 200-day simple moving average, it can be a significant sign of trend reversals.
For example, in our chart, this happened for the first time in early January 2019, when the GBP/USD pair broke above the green line. After this initial breakout, the pair did experience some pullbacks, however, after the second breakout, the pound/dollar exchange rate did manage to stay above the 200-day simple moving average for several months, until May 2019.
When the price broke below the 200-day SMA, it was also proven to be a significant sign of trend change. In Fact, after this development the pair has fallen dramatically, dropping all the way down to near 1.20 level, which was roughly 900 pips lower, compared to the point at which the market price crossed the green line.
In fact, this is not the only time when this type of move had a significant impact. For example, in October 2019 the price once more broke above the 200-day SMA. This signaled a new uptrend for the pair. As a result, the GBP/USD rose steadily until reaching 1.35 level.
However, before the end of the year, both 20-day and 50-day simple moving averages were already moving lower, suggesting that the short term trends already turned against the pound. This prediction was confirmed in March 2020, as the price one more broke below the 200-day simple moving average and fell dramatically. This sharp drop was rather short-lived. At the moment the price seems to be stabilized close to 1.25 level.
Contradicting Indicators
As we can see from the above example, moving average indicators can be very helpful for the purpose of trend identification and also can provide us with valuable insight into the possible reversals. However, there can be some scenarios where they might be giving out confusing signals.
For example at the end of our chart, it might be a bit difficult to come up with accurate predictions about the future direction of the currency pair. The fact of the matter is that the indicators are contradicting themselves. One the one hand, the 20-day moving average is still moving downwards, suggesting that the pair might still be engaged in a downward spiral.
However, on the other hand, the 50-day simple moving average, represented by the orange line, is moving upwards since May 2020, which can be an important sign of reversal and upcoming recovery of the currency pair. At this point, 200-day SMA is less informative since it remained relatively flat during the last couple of months. Therefore, here one can admit that this might not represent the best setting for moving average analysis in Forex.
So at this point, the obvious question is how would the moving average Forex trading work in this sort of situation? Well, firstly this suggests that there is no one best moving average indicator in Forex, instead each of them can have decent informative value, depending on the circumstances. However, when it comes to our chart, one logical way to resolve this is to analyze the points where the 20-day and 50-day simple moving average have contradicted each other.
We have already discussed the fact that this has already taken place back at the beginning of the chart when the 20-day simple moving average moved higher but contradicted 50-day SMA, which mostly moved lower. In this particular case, the 50-day SMA was proven to be more accurate in predicting future market movements than its 20-day counterpart.
This was not the only instance of this sort of contradiction. There were cases when the 20-day SMA was quicker to predict the beginning of a new trend than the 50-day SMA. However, during late March 2020, the red line moved higher pointing at possible trend reversals. Yet, in this instance, the orange line once more was proven to be more accurate, since it continued its downward movement until the pair reached a bottom during May 2020.
So as we can see from those analyses, there were instances where each of those indicators might have been more useful than the other. However, generally speaking, a 50-day simple moving average might be slightly more reliable for forecasting, than its 20-day counterpart, although there are always some exceptions to this rule.
Specifics of Exponential Moving Averages
As mentioned earlier, the simple moving average indicator is not the only measure to identify the latest trends in Forex. In fact, many people make use of many professional experience trades very frequently to make use of the exponential moving averages, when they compose their moving average strategy in Forex.
The main difference between those two indicators is that the exponential moving average indicator tends to give lesser weight to earlier closing prices and greater weight to more recent ones. In order to better illustrate the differences between those two indicators, let us take a look at this daily EUR/GBP chart:
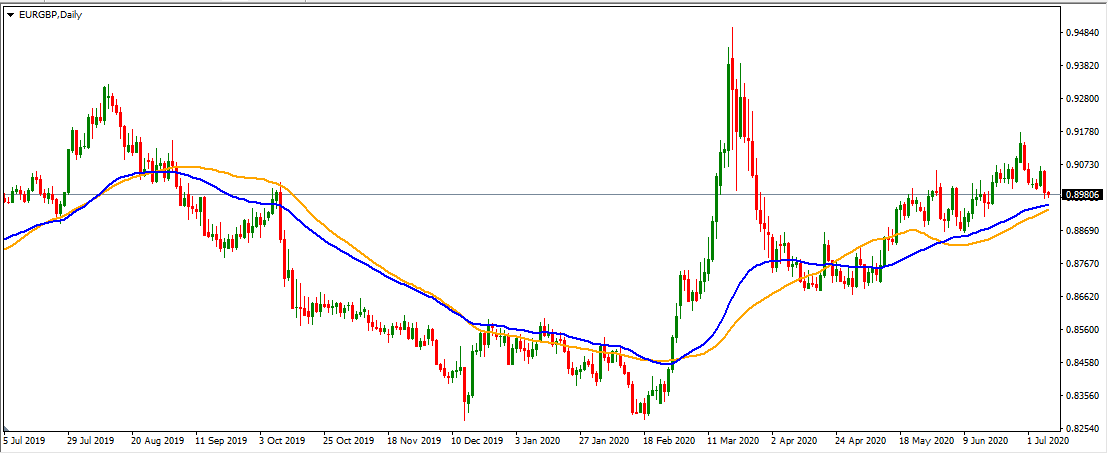
Just like in the previous diagram, the orange line represents the 50-day simple moving average. The blue line in this chart is representative of the 50-day exponential moving average. Now as we can see from this diagram, for understandable reasons those two indicators are highly correlated with each other. Therefore, in the majority of cases, they tend to move in the same direction.
So at this stage, the obvious question is: how do they differ from each other in this chart? Well, in order to answer this question we need to identify points where they have diverged from each other. If we take a closer look at our latest chart, we can see that one instance of this scenario was in March 2020. At that time the EUR/GBP pair rose sharply, rising from 0.83 to 0.94 level. However, this massive appreciation was followed by a notable correction, as a result of which the pair dropped lower near 0.86 level. Finally, after weeks of consolidation, the Euro resumed its upward trend and currently trades close to 0.90 level.
So how did those two indicators differ during this period? Well, the 50-day simple moving average line moved consistently higher, with a small exception during May 2020. Therefore, if a trader decided to use this moving average method for Forex trading and analyzed the 50-day simple moving average, then most likely he or she would have decided to open a long EUR/GBP position.
Now if this was a long term trade, he or she would have done quite well. From the duration of this period, the pair has risen from 0.83 to 0.90. This represents a 700 pip increase in 5 months, which would be the equivalent of an 8.4% increase.
The movements of the 50-day exponential moving average indicator were quite different. This is not surprising, because as mentioned before, the moving average formula in Forex for this measure is quite different from that of SMA.
From late February 2020 until late March 2020, the blue line rose sharply, pointing at reversal and possible appreciation of the currency pair. However, from late March the line began to flatten and even moved slightly lower. Finally, from the beginning of May, the 50-day exponential moving average changed its course and moved steadily higher.
So as we can see the differences here are very similar to that of between 20-day and 50-day simple moving averages. The bottom line here is that the 50-day exponential moving average was quicker at detecting possible trend changes. On the other hand, the 50-day simple moving average was better at the task of exposing false breakouts and protecting traders from subsequent suffering heavy losses.
In general, one can argue that the exponential moving averages might be more suitable for shorter term trades. At the same time, the 50-day simple moving average indicator might be more handy with those traders who open positions with larger time frames in mind.
Imperfections of Moving Average Indicators
Before moving on concluding remarks, it is important to mention that despite all of their uses, the moving average indicators does not represent an infallible source for predicting the future currency movements. In fact, there are several reasons for this.
Firstly, as we have seen in our examples, sometimes the moving averages, covering different duration can contradict each other. This can confuse traders and make it incredibly difficult to make any accurate predictions.

The second common problem with this type of analysis is the fact that sometimes both simple and exponential moving average indicators can be late in identifying the trend reversals. Before the indicator lines change their directions, the market might move 100 or 200 pips against the trader’s position. At that point, it might be too late for the market participants to respond to those changes properly and avoid suffering heavy losses in the process.
Finally, it is worth noting that the moving average indicators do not take any economic factors into account, but they are purely based on past price action. Therefore, limiting the entire Forex analysis to moving averages can be potentially misleading and can lead to some significant losses.
For example, in a EUR/AUD currency pair, the 50-day moving average might be moving higher, suggesting that the Euro might still be in an uptrend. However, during the same time, the European Central Bank might surprise markets with a massive expansion in its quantitative easing program, resulting in a significant drop in the Euro exchange rate.
Alternatively, the Reserve Bank of Australia might hint at a possible upcoming rate hike, strengthening the exchange rate of the Australian dollar and leading to a sharp fall in EUR/AUD.
So essentially, we can come up with a large number of scenarios were only relying on moving average indicators can be very misleading. Therefore, it would be to combine moving averages with other fundamental and technical indicators when analyzing the currency pairs.
Moving Average in Forex Explained – Key Takeaways
- Moving average indicator aims to filter out all of the daily market noise and helps traders to get a clearer picture of the latest trends in a given currency pair. It is calculated by the average closing price of the security during the specified amount of time. There are essentially two types of such indicators: the simple moving average and the exponential moving average. They tend to be highly correlated, but the main difference between those is the fact that the former gives equal weight to all closing prices. On the other hand, the exponential moving average gives greater weight to more recent prices.
- Many experienced traders use a 20-day simple moving average as an important indicator of short term trends. At the same time, 50-day SMA can be more useful for determining the medium term direction of the given currency pair. Finally, many professional traders make use of a 200-day simple moving average for determining the long term trends. For a more thorough analysis, many market participants use several moving average indicators together. Some people might use a 20-day simple moving average, in conjunction with a 50-day SMA, or any other combination of those types of indicators.
- The direction of the movement of moving averages can give valuable insights into the latest trends in a currency pair. If for example, the 50-day simple moving average is moving lower, then this might be an indication that the pair is still in a downward trend. On the other hand, if 50-day SMA moves higher then it can point out the fact that the security remains in an upward trend. When the moving average indicator changes direction it can be interpreted as the sign of reversal. Finally, if the moving average line remains flat, it is usually a result of consolidation and range trading.