Table of content
PPP indicator in Forex stands for Purchasing Power Parity. This indicator basically shows the exchange rate of two currencies, at which the average prices of goods and services will be equalized between those two countries.
Due to interest rate and economic growth rate differentials, as well as other economic and political factors, Forex pairs tend to deviate from the PPP levels. As a result, those currencies which trade below the PPP level, are considered to be undervalued and typically, in the long term, tend to appreciate against other currencies. On the other hand, currencies trading above PPP, are deemed as undervalued and usually tend to face some major corrections at some point in the future.
When explaining what is PPP, it is essential to point out that there is no single universally accepted Purchasing Power Parity formula. Instead, it is measured by several major organizations and each of them has its own specific methodology for those calculations.
One of the most famous measures of PPP economic indicator is the one published by the Organisation for Economic Cooperation and Development (OECD). This essentially includes tracking and comparing the prices of thousands of goods and services between two countries and then producing the exchange rate at which, the average price for those baskets could be equalized. The OECD updates Purchasing Power Parity rates for dozens of currency pairs regularly, on an annual basis.
Another popular, yet more simplified version of the PPP is published by the British financial magazine the ‘Economist’. Since 1986 it has regularly published the Big Mac Index (BMI). As the name suggests it tracks the average price of Big Mac in dozens of countries. During recent years, this measure became popular with experienced traders and financial experts, due to its simplicity. BMI includes the price of bread, sesame seeds, cheese, cucumber, lettuce, beef, cost of rent, electricity, transportation, and taxes. Therefore, one can argue that this measure represents a well-diversified basket of goods and services.
Any serious study of PPP Forex strategy would suggest that this a long term indicator and must be treated as such during the trading. It is worth keeping in mind that due to a variety of reasons, currencies can stay at highly undervalued or overvalued reasons for months or even years. Therefore, it is much better to use Purchasing Power Parity for long term trading or investing purposes.
PPP Indicator Explained
After covering the basics of this term, there is an obvious question: what does the PPP performance indicators tell us about currencies and how can they help us forecast the future exchange rates?
Here it is helpful to note that the entire PPP theory stands on two principles. Firstly, in the long term, the undervalued currencies tend to appreciate against the overvalued currencies. So why is this the case? Well, it goes without saying that there are always individuals and corporations who are interested in importing raw materials, as well as other goods and services from abroad.
So if a given country the average pieces of those items are lower than in other nations, then it becomes a more attractive place for importers. After all, in purely business terms, it does not make much sense to buy expensive goods at home, where one can import the same products from abroad at much cheaper prices.
However, here it is helpful to remember that in order to access those goods and services, an individual or organization must convert their own currency into the currency of that particular country, from where they intend to import those products. Therefore, this creates an increasing natural demand for the currency in question.
As the basic economic principle of supply and demand suggests, when the latter one increases, it also tends to push the price up. Therefore, in the long term, the undervalued currency tends to appreciate against its peers.
How does Inflation Differentials Affect Exchange Rates?
The Second important theory behind the PPP development indicator is the fact that currencies with lower inflation rates tend to rise against the ones with higher Consumer Price Index rates. This might sound somewhat counterintuitive. After all, do not Central Banks raise their key interest rates when the inflation rate goes above the intended target? Are not the higher-yielding currencies more attractive to traders and investors?
Those are indeed some valid points and they are true when it comes to short term trading. So for example, the Reserve Bank of Australia aims at 2% to 3% CPI. Now if the inflation rate in Australia jumps to 3.5%, that might be beneficial to AUD in the short term. The reasoning behind this is the fact that RBA is more likely to respond to this development by hiking rates by 0.25% or even 0.5%. As a result, carry traders and depositors can earn higher returns on AUD denominated assets.
On the other hand, this might not be such good news for the Australian dollar in the long term. Here it is important not to forget that the inflation indicator essentially measures the annual rate at which the currency loses its purchasing power. Therefore, currencies with consistently low inflation rates do hold on to more of it’s buying power, than the ones with higher CPI rates.
Another obvious reason for this is the fact the countries which have low Consumer Price Index rates, over time tend to have cheaper goods and services, compared to other nations, since the annual price gains for those products are quite small. So those two factors, described above, tend to favor currencies with lower inflation rates.
This does mean that in the long term, a moderate amount of deflation can be even beneficial to currencies. In the short term, this leads to easing policies from central banks, weakening the currency for several months, but after that period, it tends to strengthen against its peers. The basic premise here is this: Better the currency manages to hold on to its purchasing power, the stronger it becomes against other currencies.
It is impossible to explain the strength of the Japanese yen and Swiss franc without turning to PPP analysis. The Bank of Japan, as well as the Swiss National Bank, did nearly everything in their power to weaken their respective currencies. They kept their key interest rates close to zero for decades. They even turned to negative rates, with BOJ setting them at -0.1% and SNB even going as far as -0.75%.
Those measures did reduce the value of CHF and JPY for several months. However, the issue here was the fact that after this initial depreciation, those currencies eventually regained those losses. During the last few years, the Bank of Japan did finally manage to achieve its 2% inflation rate target and manage to devalue its currency to a certain extent. However, when it comes to the Swiss currency, it is still well into the deflation territory, making some important long term gains against other currencies.
Obviously, the opposite is also true. If a currency suffers from persistently high rates of inflation, then in the long term it usually tends to lose ground against other currencies. For example, the Central Bank of the Republic of Turkey (CBRT) held high-interest rates for years, keeping them at 8.25% by June 2020. However, the lira still keeps depreciating. During the last 3 years, the USD/TRY has risen from 3.50 to 6.85. One of the reasons for this is high inflation rates in Turkey, which currently stand close to 15%.
Using PPP Indicator in Trading
Despite going through the definitions and examples of Purchasing Power Parity, there are still some logical questions remaining: How to trade Forex with PPP? How would PPP financial viability indicator model look like in trading and investing?
To respond to those questions, it is important to recognize that the first essential step for implementing this strategy is the identification of undervalued and overvalued currencies. For the purpose of better understanding this concept, let us take a look at this daily GBP/USD chart:
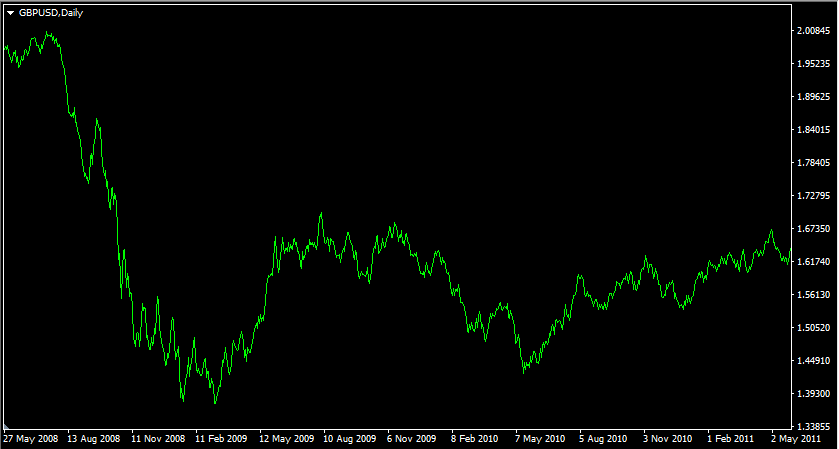
As we can see from the diagram above, by summer 2008, the British pound was trading within $1.95 to $2.00 range against the US dollar. At that time, the latest release of PPP numbers by Organisation for Economic Cooperation and Development (OECD), showed that the fair value of GBP/USD was near 1.41. In June 2008, the Economist released its Big Mac Index, according to which the PPP implied exchange rate for this currency pair was at 1.56. So this suggested that the British pound was at least 28% overvalued against the US dollar.
Those forecasts actually were proven to be quite accurate. From August 2008 the pound began its slide, eventually dropping to $1.40 level by January 2009. This was followed by the correction and sideways movements until the pair has stabilized between the $1.55 to $1.65 range. So as we can see from this example, in this case, the Big Mac Index managed to correctly identify the undervaluation of USD, as well as the level which we can call a ‘fair value’, around which the exchange rate eventually settled down for a few months.
Obviously, this was not the only example where using the PPP trading rule would have paid off. In order to see another clear example of a similar scenario, we can take a look at this daily EUR/USD chart:
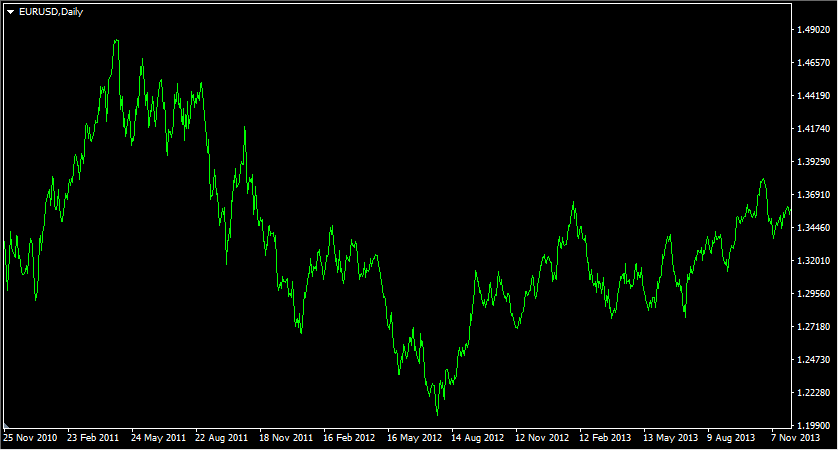
As we can see from the diagram above, by early 2011 the pair was rising steadily, eventually reaching $1.48 level by the end of February of that year. This was surprising for many analysts and traders since the Eurozone was in the middle of the Eurozone Sovereign Debt Crisis and it was not at all clear, whether the currency block could recover from its damaging effects.
However, there was another reason to be bearish on the Euro. As OECD published its data, among its world development indicators, PPP for EUR/USD was around 1.26. The Big Mac index also showed a significant degree of Euro overvaluations, putting the Purchasing Power Parity for EUR/USD at 1.18.
Once more, those predictions turned out to be accurate, as the pair dropped steadily through the second half of 2011, extending its losses well into 2012 until the Euro fell to $1.20 level. During the subsequent months, the single currency did recover from those levels, however, the PPP indicator has also moved on as a result of the changes in terms of inflation differentials between those two economies.
This is another important factor to remember when discussing a proper Purchasing Power Parity trading strategy. PPP is not a static indicator, which shows the same exchange rates for years to come. Instead, it does change at least on an annual basis, essentially moving in favor of those currencies, which have lower inflation rates. So this is something to be aware of when making trading and investing decisions.
Long Term Trading with PPP Indicator
So what should be a proper PPP trading strategy? Well, the implementation of this method firstly involves the research of major currency pairs which have deviated from the Purchasing Power parity level by 20% or more. The reason behind this is the fact that the historical analysis of exchange rates shows that 5% or 10% undervaluation might be too small to make any significant impact on the market. However, when it comes to the larger imbalances, the corrections come much more often.

Essentially, PPP Forex trading is a long term strategy, where traders purchase highly undervalued currencies against the overvalued ones and finally capitalize on potential profits once the market corrects the imbalance.
For the sake of accuracy, it is worth noting that the PPP is not only useful in Forex trading, but it can also serve as a viable investment strategy as well. Here the basic principle is very simple: after identifying several undervalued currencies, investors can prioritize buying those assets, which are denominated in that currency.
Those can include dividend-paying stocks, Certificates of Deposit (CD), sovereign bonds, and rental properties. Here investors can not only benefit from the income stream but also profit from the potential appreciation of the value of the currency in question.
Imperfections of Purchasing Power Parity Trading Strategy
As we have discussed before, the PPP can give investors and traders valuable guidance on the possible future path of currency exchange rates. However, just like any other Forex indicator, it is not an infallible source for making predictions about currency movements and can not guarantee a 100% success rate. In fact, there are at least 9 different ways one can predict the Forex market.
In order to better illustrate the imperfections of the Purchasing Power Parity indicator, let us take a look at this daily USD/RUB chart:
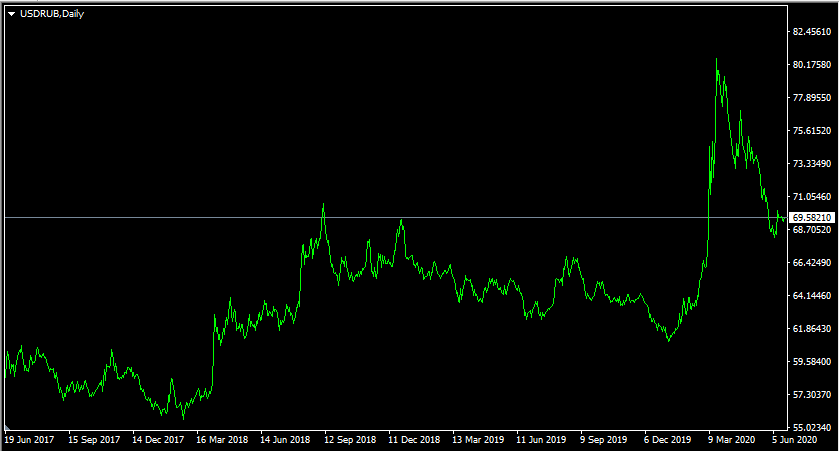
As we can see from the above image, by summer 2017 the pair traded near 66 mark. During the subsequent month, the Russian currency depreciated steadily, with USD/RUB eventually reaching 81 level, by September 2018. Despite those setbacks, the Russian ruble recovered and erased nearly all of its losses during 2019, with the pair trading at 68 level, by the end of the year. This was followed by the panic selling in February 2020, when USD/RUB briefly jumped to 87 level, before facing a correction and stabilizing around 78 mark.
After considering those developments, it might be very surprising to know what PPP indicators have to say on the subject. According to the OECD, the fair value for this pair stands at 25.70, with the Big Mac Index suggesting 23.80 level as a proper Purchasing Power Parity exchange rate. It goes without saying that both of those indicators suggest that the Russian ruble is massively undervalued.
So how can we explain the fact that the RUB stayed in those extremely undervalued levels for several years? Actually there can be several reasons for those:
- The Russian economy is heavily dependent on oil prices since roughly half of the government revenues come from this particular sector. Recently weakness in oil prices had a very negative impact on currencies such as the Canadian dollar and the Russian ruble. The lower energy prices mean that many companies in those countries will likely face financial difficulties, while local governments can also potentially lose a significant portion of their revenues.
- The Purchasing Power Parity indicator does not necessarily take into account geopolitical events which can have a significant impact on the exchange rates. The Russian ruble fell dramatically in 2014-2015 as a result of conflict with Ukraine and due to sanctions imposed by the US and EU on the country. As a result, some investors considered RUB denominated assets to be too risky and liquidated them, leading to notable currency depreciation.
- The market tends to correct the majority of Purchasing Power Parity imbalances within a couple of months or years. However, there are some cases where the undervaluation or overvaluation can persist even for a decade. One example of such an extreme case is the Norwegian Krone. From 2002 until 2014 the currency was very overvalued against the Euro and the Dollar, however, from 2015 the currency finally returned to its PPP levels.
Obviously, the arguments mentioned above does not imply that the Russian ruble will always stay at undervalued levels. At some point in the future, the economic situation might change and RUB might get closer to its PPP level. However, as we can see when it comes to some emerging market currencies, their undervaluation can persist for many years. However, in the case of major currencies, such occurrences are very rare indeed, since they represent more liquid assets and more stable economies.
Another important thing to note here is that the Purchasing Power Parity is not that helpful for short term trading. It is a long term indicator and is not really well-suited for scalpers and day traders. Therefore, if a trader prefers that sort of trading style, then most likely he or she would be much better off focusing on the latest economic news releases, central bank interest rates, and other short term indicators.
Finally, it is worth noting that despite all of those imperfections, mentioned above, the Purchasing Power Parity indicator can be a very handy tool for long term investing and trading decisions. It is also a very simple indicator to utilize. It does not require a very complex chart analysis or years of trading experience in order to employ PPP strategies successfully. So one can argue that the benefits and uses of the Purchasing Power Indicator far outweigh its imperfections.
Understanding PPP Indicator
- The Purchasing Power Parity (PPP) measures the exchange rate at which the average price of goods and services can be equalized between the two countries. This indicator is measured by several organizations, including the Organisation for Economic Cooperation and Development (OECD) and British financial journal the ‘Economist’. PPP is not a static indicator and it is updated at least on an annual basis, reflecting the relative changes in the average price levels between different countries.
- The basic idea behind the Purchasing Power Parity (PPP) relies on two assumptions. Firstly, in the long term, currencies that trade below PPP level, tend to appreciate against the overvalued ones. Secondly, countries with consistently lower inflation rates tend to benefit from the appreciation of their currency against the ones with higher inflation rates. Therefore, the PPP trading strategy aims to capitalize on those two assumptions.
- The essence of a proper PPP trading method is very simple. It involves the identification and purchase of highly undervalued currencies and selling overvalued ones. In many cases, it can be a viable long term strategy and is not that useful for short term trading purposes. It is also important to mention that PPP is not only useful for trading but also can be a very useful tool for analyzing potential investments as well.