Table of content
When it comes to the long-term currency trading strategies, they differ from other short term methods like scalping or day trading in the sense that they focus on identifying and then capitalizing on the Forex trends. It goes without saying that there is no one long term trend trading Forex approach which can always guarantee success.
However, the historical analysis shows that there are several ways to identify those trends with a relatively high degree of accuracy, which can certainly help traders to place winning traders and earn some decent payouts in the process.
Firstly, we have nominal interest rates. The monetary policy differences can have a notable impact on the Foreign Exchange market. This provides opportunities for long term trend following in Forex trading. When two central banks follow very similar policies, this might make very little difference for the exchange rate movements. However, when one central bank raises rates steadily and the other cuts rates or maintains a very dovish stance, this divergence can certainly lead to the surge of one currency in a given currency pair.
Also, it is worth noting that the relative real interest rates can have a significant influence on the long term direction of the exchange rates. This means that if the differential between the key interest rate and inflation of a given currency is larger than its peers, it is likely to appreciate over time. The reasoning behind this is the fact that the currency is more attractive to traders and investors when its deposits and other fixed-income instruments can retain their buying power.
Finally, the Purchasing Power Parity (PPP) can exert a significant influence on the Forex market. This term is defined as the exchange rate at which the average prices of goods and services is equalized between the two countries. Therefore, when the major currency pairs deviate significantly from this indicator, it is likely that eventually, they will return to PPP levels. This gives traders a chance to identify and potentially capitalize on those trading opportunities.
How to determine Long Term Trend in Forex?
When it comes to trading, it is obvious that there is no single best long term trend indicator Forex. However, any objective observer in the market can notice that the interest rate differentials have a significant impact on the exchange rates.
The reason for this is quite simple. Every investor and trader at the market is looking for some kind of return for their investment. Higher interest rates mean that traders can benefit from carry trading. This involves borrowing in the low-yielding currency in order to buy high-yielding currency and then profit from the interest rate differentials on a regular basis. The brokerage company usually pays daily interest to their clients, as long as they hold such trades open.

The positive impact of the high interest rates is not strictly confined to the trader community. When a given central bank raises rates, this means that investors and savers will get higher returns on savings accounts, Certificates of Deposit (CDs), and other fixed-income securities. As a result, the currency in question becomes much more attractive.
In fact, high-yielding currencies very often attract what the economists call ‘hot money flows’. This means that when the interest rates in a given country are high, it is appealing not only for domestic investors and savers but for overseas market participants as well. Foreign investors can make use of those opportunities by opening non-resident offshore bank accounts and depositing their funds, earning a considerable amount of money in the process.
This tendency even became much stronger in the aftermath of the 2008 great recession. As the majority of central banks of developed countries have adopted near-zero interest rates, the rates of Certificates of Deposits (CDs), savings accounts, and other fixed-income investments fell dramatically. Before the crisis individuals were able to easily earn up to 5% on their savings.
However, after 2008 in the majority of developed countries it became difficult to find even 2% yields on long term Certificates of Deposit. As a direct result of those developments, some market participants decided to hunt for yields among the dividend-paying stocks in the market. At the same time, many savers and investors who preferred fixed-income investments started to look elsewhere in order to earn some decent returns on their capital.
As a result of this process, the high yielding currencies become more attractive for market participants, which inevitably leads to a rise in demand. As the basic law of economics suggests, when the demand rises it tends to push the price higher. In the Forex market, this means that the currency in question tends to appreciate against its peers.
In order to illustrate how traders can engage in long-term trend trade by analyzing interest rate differentials, let us take a look at this AUD/USD daily chart:
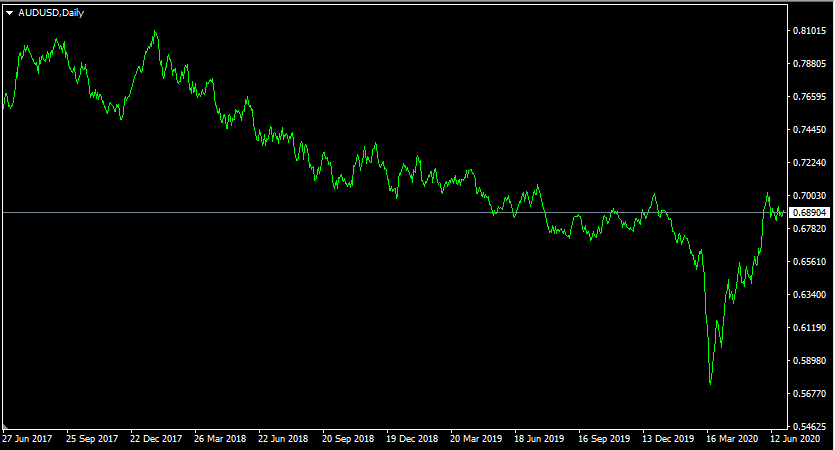
As we can see from the image above, the Australian dollar made some short-lived gains during late 2017, benefiting from the temporary weakness of the US dollar. As a result by January 2018, security has reached a peak of $0.81. However, this was followed by the long term downtrend, as a result of which, by the end of 2019, AUD/USD has dropped all the way down to $0.70 level. During the panic selling in March 2020, the Australian dollar has fallen even down to $0.57, however, then the pair recovered and stabilized around the $0.69 level by June 2020. Despite those recent gains, the current exchange rate of AUD/USD is still at least 15% lower compared to the January 2018 level.
So the obvious question here is: What drives those types of long-term trends in the Forex market? Well in our example, there was an obvious case of the monetary policy divergence.
In the case of the Reserve Bank of Australia, by 2017 the interest rates were already at 1.50%. During the subsequent years, the Australian policymakers have authorized several additional cuts. As a result of this process, at the beginning of 2020, the cash rate was down to 0.75%. The Reserve Bank of Australia has also consented to two additional cuts in March 2020, in response to the COVID-19 pandemic, bringing the rates to 0.25%.
This policy was in sharp contrast to that of the US Federal Reserve. By the beginning of 2017, the Federal Funds rate still stood at 0.75%, considerably lower than the Australian cash rate. However, the US central bank has authorized 3 rate hikes during 2017 and 4 additional rate hikes in 2018, bringing rates near 2.50% by the end of the year.
Despite those developments, the US Federal Reserve did start cutting rates incrementally from Summer 2019. The pace was accelerated by the economic headwinds, brought by the outbreak of COVID-19 pandemic. As a result, before the end of March 2020, the rates were back close to 0.25% just like during the 2008 to 2015 period.
After conducting this analysis, we can safely say that since 2017 the AUD/USD currency pair has gone through 3 stages:
- During 2017 the US Federal Reserve did start hiking rates. However, the interest rate differential in the AUD/USD pair was still in favor of the Australian dollar. As a result, the AUD has made some notable gains and risen to $0.81.
- As the Reserve Bank of Australia kept reducing rates, the US Federal Funds Rate has surpassed the Australian cash rate. As a consequence of this development, the US dollar started to appreciate against the Australian dollar, with AUD/USD falling all the way down to $0.57 level by March 2020.
- In response to the economic downturn, caused by the spread of the COVID-19 virus, both the US Federal Reserve and the Reserve Bank of Australia have adopted near-zero rate policies. In the absence of any significant interest rate differentials, the AUD/USD exchange rate has recovered to $0.69 level by June 2020 and stabilized around this area.
So as we can see from the above example, the analysis of the monetary policy of relevant central banks can very often help trades to identify short and long-term trends in the Forex market.
Relative Real Interest Rates
As we have discussed earlier, higher interest rates can certainly give a currency a certain degree of advantage over its peers. However, for the sake of accuracy, it is worth mentioning that this is not always the case. To illustrate one example of such a scenario, let us take a look at this daily EUR/TRY chart:
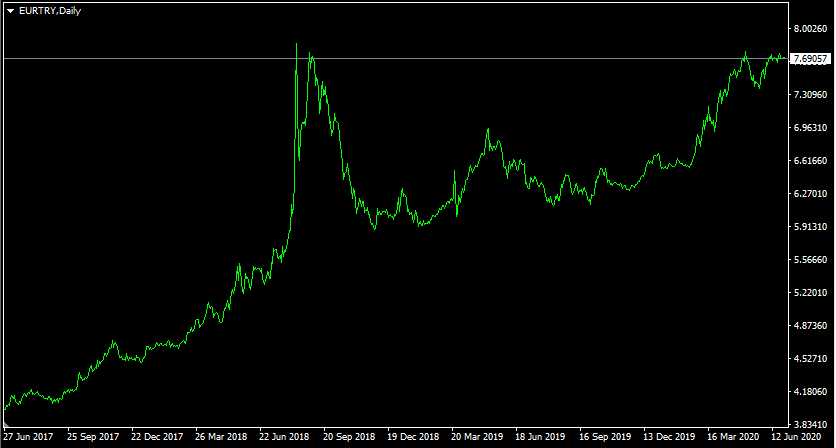
3 years ago, the exchange rate of the Euro with Turkish lira stood at a 3.97 mark. After the steady sharp appreciation of the single currency, the pair have already reached 7.70 level by August 2018. This was followed by the correction, which brought down the rates back to 5.90 mark.
However, this was proven to be short-lived, as the uptrend resumed during the subsequent months. As a result of this development, by June 2020, the pair is back at 7.70 level. This means that in just a 3 year period the Euro has risen by 94% against the Turkish lira.
Now, looking at this chart one might expect that the nominal interest rate differentials certainly have favored the single currency. However, if we take a look at those numbers, we will discover that quite the opposite is the case. Since the last rate cut back in March 2016, the European Central Bank has kept its key interest rate at 0%. This is in sharp contrast to the policies of the Turkish central bank, which kept rates within 8.25% to 24% range.
So logically speaking, one would expect that such large interest rate differentials would have pushed Turkish lira much higher. Therefore, it is surprising that instead of TRY making some massive gains, the Euro has risen by 94% during this period. So what is the reason behind this surprising development?
Well, in order to answer this question, it is worth mentioning that the real interest rates can have an even stronger influence on the exchange rates than the nominal rates. The latest Consumer Price Index report in Turkey has shown that the annual inflation rate stood at 11.3% by May 2020. This means that even at the current high nominal interest rate of 8.25%, the real interest rate in Turkey stands at -3.05%.
On the other hand, for the same period, the annual Harmonized Prices for Consumer Prices (HICP) in the Eurozone was at 0.1%. This means that the real interest rates in the Eurozone currently stand at -0.1%. This might not be ideal, but it is 2.95% higher compared to Turkey. Therefore, this gave a significant advantage to the Euro over the Turkish lira.
This is a classical case of day-trading trends against long-term trends. In the short term, when a central bank raises rates, traders tend to buy the relevant currency, hunting for higher yields. However, in the long term, we have an entirely different dynamic.
One of the main purposes of saving and investing money is to protect the buying power of the savings. Consequently, when bank deposits pay lower returns compared to the inflation rate, it tends to weaken the currency. After all, in general investors and savers are not much interested in losing their purchasing power to inflation.
On the other hand, when deposits and other fixed-income investments have higher returns, compared to the annual Consumer Price Index, this makes the currency in question very attractive. This lets savers and investors preserve the buying power of their capital and even earn some income in the process.
This is exactly how we can explain the development of the EUR/TRY exchange rate since 2017. So if investors converted their savings to Turkish lira fixed-income assets, they might receive close to 8.25% annual return. This sounds very lucrative, however, at current inflation rates, during one year period, the Turkish lira might lose 11.3% of its buying power. As a result, after one year, since making those investments, investors would gain 8.25% through interest payments, but at the same time lose 11.3% to inflation, leaving then with a negative real rate of return at -3.05%.
Compared to this scenario, putting Euros at 0% account can be better in terms of preserving the buying power of capital. Obviously, in this case, the investment would not be earning any interest, but it would at least retain nearly all of its buying power, with annual inflation at 0.1%. So in this case the real interest rate will be at -0.1%. Therefore, this is one of the main reasons why the Euro has risen steadily against the Turkish lira during the last 3 years.
Analyzing Long-Term Investments with Purchasing Power Parity (PPP) Indicator
Identifying undervalued and overvalued currencies with PPP have been one of the key long-term Forex trading strategies among the experienced traders. The indicator essentially shows the exchange rate at which the average prices for the goods and services will be equalized between the two given countries.
Here it is worth noting that there is no single universally accepted method of measuring PPP. Instead, it is measured by several organizations. One popular measure is PPP published by the Organization for Economic Cooperation and Development (OECD). The OECD makes those calculations by comparing the relative prices of thousands of goods and services between different countries.

Another, a more simplified model is offered by the British financial magazine the ‘Economist’. It’s Big Mac Index compares the average prices of this famous McDonald’s product between different countries. The reason for this choice is the fact that the Big Mac itself represents some sort of diversified basket of goods and services. It includes the price of bread, sesame seeds, cheese, beef, lettuce, cucumber, union, transportation, electricity, rent, wages, and taxes.
The rationale behind the Purchasing Power Parity theory is the fact that when the average prices on products in one country is considerably lower than in other nations, it usually raises the demand for its exports. Individuals and businesses are always looking for good deals when purchasing goods and services. However, in order to purchase those products, the foreigners first have to convert their currency into the local currency. As a result of this process, the demand for the currency in question rises and leads to its long term appreciation.
When analyzing currencies for long-term trading it is also helpful to keep in mind that the Purchasing Power Parity is not some static indicator. Instead, the PPP tends to shift in favor of the currencies with lower average inflation rates. The reasoning behind this is the fact that when the Consumer Price Index in a given country is lower, compared to its peers, over time, the goods and services in the nation become cheaper. This also tends to naturally increase the demand for currency and lead to its appreciation.
Obviously, those arguments do not imply that market exchange rates always move in line with PPP. Instead, sometimes currency rates tend to diverge from this indicator to a considerable extent. However, currency pairs very often can not defy the gravity for long and eventually return close to Purchasing Power Parity levels.
To illustrate one example of such a scenario, let us take a look at this daily USD/NOK chart:
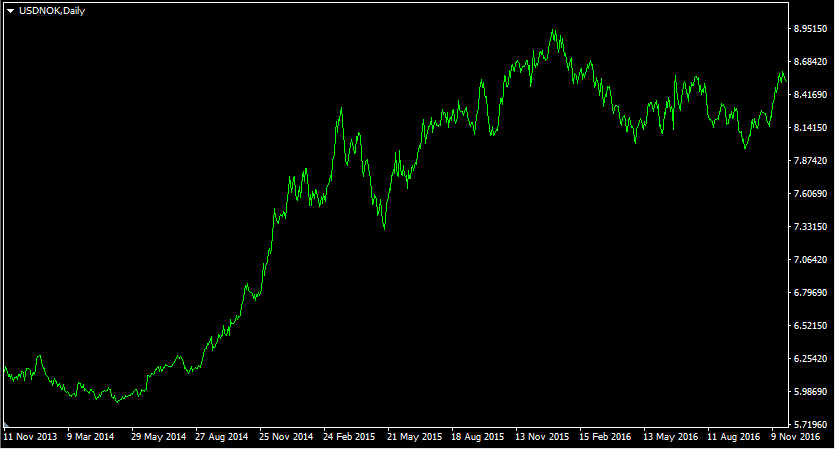
As we can see from the above example, by Spring 2014 the USD/NOK pair was trading close to 5.90 level. According to the Economist, this represented approximately more than 60% overvaluation of the Norwegian Krone. From May 2014, the US dollar has started its long term steady appreciation against the Norwegian currency. As a result of this development, the USD/NOK currency pair has already surpassed 8.90 level by January 2016. This means that during this period the US dollar has gained more than 50%. After this large move, the pair stabilized and moved sideways for some time.
So as we can see from this example, in the long term market usually corrects the imbalances in terms of PPP, therefore traders do have the ability to open the appropriate positions and then subsequently capitalize on those types of opportunities.
The only downside to this indicator is the fact that in the short term, it might have very little impact on the exchange rates. As we have seen from the USD/NOK example, if a given currency is 60% undervalued, it does not mean that it will rise by 60% in a few trading sessions. Instead, sometimes it might take months or even years for the market to restore the balance between currencies in terms of PPP rates. Therefore, those indicators are best to be used with long term trades. This is essential for improving the portion of winning trades in Forex.
Identifying Long Term Trends in Forex Trading
- Long term factors in the Forex market can be quite different from short term indicators, affecting the exchange rates. The list of those factors includes the differentials between the nominal and real interest rates, as well as divergence of a given currency from the Purchasing Power Parity exchange rates. Those indicators might have very little influence on the daily movements of the Forex market. However, when it comes to the long term horizon, they can exert a notable influence on the exchange rate movements.
- Everything else being equal, the currencies with high interest rates tend to appreciate against most of its peers. The reason behind this is the fact that with those currencies traders can earn higher returns on carry traders. They are also attractive for investors and savers since they can earn high interest rates on their capital. However, it is worth mentioning that very often it is the real interest rate that matters the most, rather than just the nominal interest rate since the former indicator takes into account the inflation.
- The PPP indicator indicates the exchange rate at which the average prices of goods and services in a given country will be equalized. The Purchasing Power Parity theory does not assume that the market exchange rates have always had to follow this indicator closely. In fact, there are plenty of cases when the currency pairs have diverged from PPP indicators to a significant degree. However, at some point, the market tends to address those imbalances and drives market rates close to PPP levels.