Table of content
One of the most important aspects of the stock market investing is the question of building a successful investment portfolio. This essentially represents the collection of stocks and other investments the investor owns.
It goes without saying that not all portfolios are the same, they obviously differ in composition and the goal as well. For example, some investors are more oriented towards building a solid growth portfolio, while others want to build a dividend portfolio. In this article, we will focus on the latter scenario.
The fact of the matter is that the consistent rate cuts by the world’s all major central banks have made it virtually impossible to earn some decent returns on the savings accounts and certificates of deposit. Consequently, it is not surprising that the people started to look for some reasonable alternatives. One of those possibilities is to invest in dividend-paying stocks.
Here it is worth noting that the fact that an individual company pays a payout to shareholders does not always mean that it is a good investment. Building a portfolio for income requires thorough due diligence. This involves firstly checking the dividend history of the company over the years.
In addition to that investors should take into account the company’s recent financial performance, both the sales and profit growth figures, as well as other important indicators.
It is also helpful to analyze the industry the individual stock is involved in, as well as its beta indicator. Here the market participants should look for so-called defensive stocks. This means that the company should operate in such a sector, where the people will still buy company products regardless of the economic conditions. Those stocks typically have a low beta, which means that they tend to be less volatile than the broader market.
If an individual stock passes those three key tests, then the investors should focus on the current valuations of the security, by checking earnings per share (EPS) and price to earnings (P/E) ratios.
In addition to the P/E ratio, it is also important to check the payout ratio as well. This essentially measures the percentage of profit paid out to shareholders.
Finally, it is always helpful for the market participants to take a look at the dividend yield of the stock. This essentially measures the percentage rate of return dividends, compared to the invested amount.
Benefits of Setting Up Stock Portfolio for Income
Firstly, before moving on to the tips to build an income-producing portfolio, it is worth discussing why some would be interested in this investment style. After all, many people in the stock market generally aim to buy low and sell high, making a profit in the process.
However, at this point, it is important to make a distinction between trading and investing. It goes without saying that there are indeed some risks involved with both of those, however, it is obvious that trading, in general, is much more risky activity than long term investing.

Consequently, there are many people who are not really comfortable with risking their hard earned money on day trading. Instead, they want to earn some income on a regular basis, in order one day to be able to cover all of their living expenses from this type of income.
Another major benefit of building a portfolio for income is that the market participants do not have to work on a daily basis in order to maintain this type of revenue stream. When it comes to traders, they have to keep buying and selling stocks in order to keep earning money, if one day they decide to take a break, they will not receive any revenue.
On the other hand, once an investor builds a solid portfolio, it will start producing a passive income. In fact, if the size of the portfolio is large enough for the revenues to cover all living expenses, an individual will also have an option to retire early.
Here it is also worth mentioning that the recent adoption of the near-zero interest rate policies by all major central banks, makes dividend investing an even more attractive alternative. The reality of the matter is that when it comes to the reserve currencies in the world, the long term average inflation rate is mostly close to 2% to 3%.
So the fact that some central banks keep rates at 0.25%, means that if individuals deposit money on savings accounts or certificates of deposit (CDs), they would be losing their purchasing power. It is true that there are some online banks that might offer 1% return on CDs, however, considering the long term average inflation rates, this rate is not enough to maintain one’s purchasing power.
On the other hand, some solid blue chip stocks still have dividend yields ranging from 2% to 6%, which makes them an attractive alternative to the fixed income securities mentioned above.
It goes without saying that for those investors who wish to build an income portfolio, they always have an option to invest in the rental properties in the real estate market. Indeed this market has made more millionaires, than all of their investment. However, it is worth noting that an individual needs a considerable amount of capital to at least come up with a down payment to purchase the property, which can range from $10,000 to $100,000, depending on the home in question.
One the other hand, the stock market investing does not require such a large amount of capital to get started. In fact, there are some direct stock purchase plans, as well as some stock brokerage accounts, which enable investors to start investing with as little as $50 regular monthly payment.
So as we can see here there are many reasons why investing for income in the stock market can be a worthy choice for many individual investors. Now let us go through each of the steps for creating a stock portfolio for income in more detail.
Dividend History
The first thing an investor might want to do when choosing stocks for an income portfolio is to take a look at the dividend history of the individual company. This is a very important aspect of the due diligence process. If the company has not paid any dividends in the past, or just began doing so, then it might not be the best choice for this type of portfolio. In general, some experienced income investors look for at least 10 years of solid dividend history when picking the stocks.
Another important thing to look into in dividend history is consistency. For example, if the company in one year raises its payout to shareholders by 10%, only to cut it by 50% next year, then it might not be the best place to invest for income. It is much better to identify a company, which has not cut dividends for at least a decade.
Finally, when it comes to dividend history it is important to identify those companies, which demonstrated their ability to grow those payments over time. Due to loss of revenue or other financial problems, it might happen that some firms might decide to keep their payouts unchanged at the same level for a year or two. However, if they keep dividends flat for many years, then it is not surprising that inflation will erode a significant portion of the purchasing power of those payments. Therefore, it is better to find firms that managed to raise their payouts to shareholders at least several times during the last decade.
This might be surprising to some people, but there are several companies that managed to consistently increase their dividend payments for several decades now. Just to take one example, we can check out this chart, which shows the dividend history of Coca-Cola Company:
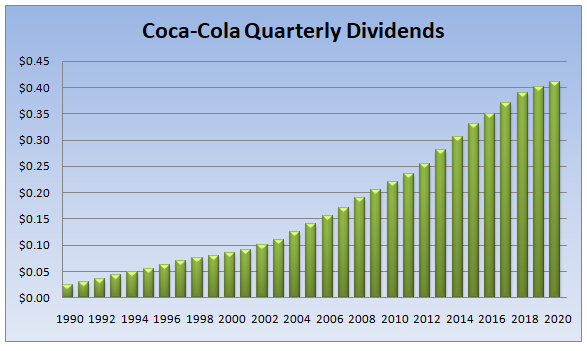
As we can see from the above diagram, 30 years ago, adjusting for the stock splits, the firm paid 2.5 cents per share on a quarterly basis. During the next subsequent years, firm management has increased its payouts consistently. As a result by 2002, the quarterly dividend has already surpassed 10 cents per share.
In fact, the Coca-Cola Company was able to increase its payouts to shareholders even during the 2008 Financial Crisis. By 2020, the quarterly dividend has already reached 41 cents per share, putting the total annual payout at $1.64.
This means that during those 3 decades, the average annual growth rate of the dividend was 9.77%, which is more than 3 times higher than the average long term rate of inflation. It goes without saying that when a company has such a solid track record of returning money to shareholders, it is well-positioned to continue to do so in the future.
The Coca-Cola Company is not the only corporation with a solid dividend history. Another example of this is McDonald’s. A chart below shows the annual dividend payments of the firm since 1995:
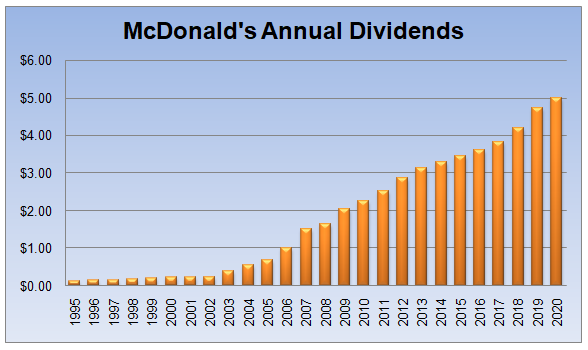
As we can see from the above image, the company paid just 12.5 cents per share to its shareholders back in 1995. The firm already managed to increase its payouts to $1.00 mark by 2006. It is also impressive that the 2008 financial crisis did not prevent the company from growing its profits further and raising its dividends in the process.
By 2020, the total annual payout to shareholders per share has reached $5.00, which is 40 times higher than 25 years ago, which is quite impressive. In fact, the average rate of dividend growth during this period stands at 15.9%, which is more than 5 times higher than the long term average US inflation rate.
Recent Financial Performance
It goes without saying that the solid dividend history is a big plus when it comes to constructing a stock portfolio for income. However, as the old saying goes, the past performance does not guarantee future performance. The management of the individual firm might have delivered impressive results during the previous years or even decades, but this does not automatically mean that they will be able to do so indefinitely.
This is why it is important to take a look at the latest financial indicators of the company. The annual reports, as well as quarterly publications of results, are usually available at the official website of the firm, in the ‘investor relations’ section. Here firstly, the market participants can take a look at the latest sales figures, if the firm increases its revenue at a decent pace, then it might be well-positioned to continue to deliver results to shareholders. On the other hand, if the sales are falling or stagnating that might create significant problems for the management down the road.
In addition to revenue figures, it is also helpful to take note of the recent profitability figures of the firm, including the earnings per share indicator, also known as EPS. This indicator is essentially calculated by dividing the profit of the company by the number of outstanding shares.
At this stage, some people might ask quite a logical question: Why one has to complicate the analysis by taking a look at EPS when there are the latest profit figures available at every earnings report? Well, the fact of the matter is that some companies do authorize the use of funds for the purpose of buying back some of its shares. Consequently, the overall number of outstanding shares might decline over time. As a result, the growth rate of EPS might be higher than that of the net profits.
In addition to analyzing those indicators, it might be helpful to take a look at the latest dynamics of the free cash flow of the firm as well as observing the value of its assets and liabilities. Having a healthy cash flow situation is important for the firm to avoid getting into liquidity problems. At the same time, it is essential for the management not to take on too much debt, since the repayments might consume a significant portion of company revenues and create some serious financial problems.
Finally, it is also important to analyze the latest underlying sales growth figures by the product categories and regions, as well as volume growth numbers. The fact of the matter is that when it comes to the large multinational corporations, the Foreign exchange rate movements can significantly alter the official sales figures of the company.
For example, the firm might achieve a 3% sales growth during the year, but due to adverse Forex movements, the revenue in terms of the reporting currency might decline. Consequently, it is important to take a look at underlying sales growth and volume figures to avoid coming up with wrong conclusions.
Beta Indicator
Next on our list for how to create a stock portfolio for income is choosing stocks with a low beta indicator. This measure shows the degree of volatility of the individual stock compared to the broader market. If the beta indicator of the security is at 1.00, this means that it is exactly as volatile as the overall market.
If the beta indicator is lower than 1.00, then this suggests that the stock is less volatile than the market. Here it is worth noting that the closer the beta gets to 0, the less volatile the stock becomes.
On the other hand, if the stock is more volatile than the overall market, then its beta indicator will be higher than 1.00. So if this indicator stands at 2.00, this means that the security is twice more volatile than the market. Here it is important to note that the maximum level of beta is not limited to 2.00. In fact, there are stocks with 2.20 or even 3.00 beta indicators as well.
So what is the reason behind this difference in terms of the degree of volatility between different stocks? Well, one of the main reasons for this is that they operate in different sectors of the economy. In fact, there are some industries where the company earnings tend to be more stable, compared to other sectors.
For example, there are many good dividend-paying low beta stocks in the consumer goods, as well as the foods and beverages sector. The reasons for this are simple: those firms provide products which are essential for human survival on a daily basis. So even if there is an economic downturn or even a prolonged period of recessions, people will still buy food, drinks, as well as personal hygiene and home cleaning products. They might let go of expensive vacations or luxury products, but they will still spend money on their basic necessities.
In fact, those types of ‘defensive’ stocks are not strictly limited to those categories. The securities of pharmaceutical companies, producers of alcoholic beverages, and providers of utilities also fall into the same category. When it comes to pharmaceuticals, it is obvious that people will always take medicine, whether the economy is in booming times or in a recession. It goes without saying that the majority of the population do prioritize spending on healthcare, over other categories.
The stocks of the providers of utilities also tend to be generally less volatile than most of their peers. The reason for this is that consumers will usually keep consuming the electricity, gas, and water on a regular basis, regardless of the economic circumstances in the country.
The case of alcohol producers is curious. Unlike the majority of the cases, we have discussed so far, consuming those types of drinks does not represent a daily necessity for human survival. However, the reality of the matter is that even those people who consume alcohol in moderate amounts very often tend to form a habit to consume wine, whiskey, vodka, beer, or other types of alcoholic beverages on a regular basis. Consequently, they become loyal consumers of their favorite brands.
In addition to that, it is worth noting that the recession and other financial problems generally do not have a negative impact on the sales of alcoholic beverages. If there is any economic effect, one could argue that it is quite the opposite. People, worried about their financial situation, are likely to consume alcohol more frequently than before.
To illustrate one example of this, let us take a look at the dividend history of Diageo PLC, the world’s one of the largest producers of alcoholic beverages:
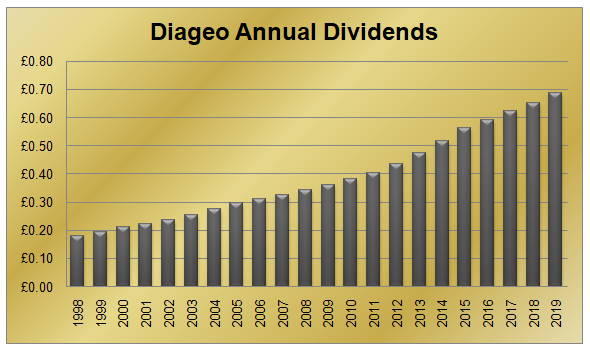
As we can see from the chart, back in 1998, the annual dividend of Diageo PLC stood at just 18p per share. Over the subsequent years, the firm was able to increase its payouts to shareholders on a consistent basis. In fact, the progressive dividend policy persisted even during the 2008 Financial Crisis.
By 2019, the annual payout has already reached 68.6p per share. This means that on average, the company was able to hike its dividend by 6.58% during this 21 year period. This is an impressive achievement since it is more than 2 times higher than the average inflation rate in the United Kingdom, the country in which the firm has its headquarters.
Those are essentially the main reasons why the stocks of those companies outlined above tend to be more resilient and retain more of their value in times of economic decline, compared to securities of firms in other sectors of the economy. The stability of company sales is essential for making it possible for the firm to pay a consistent dividend to its shareholders.
Therefore, it might be a very helpful idea to find those stocks which have a relatively low beta, below 1.00. In fact, the stocks we have discussed above have their beta indicator within the 0.20 to 0.60 range. This means that those securities are considerably less volatile than the overall market. In addition to that, it is also helpful to identify those stocks which operate in sectors outlined above, where sales tend to be more stable than in the case of other industries.
Payout Ratio
The payout ratio is yet another important indicator for choosing stocks for building an income portfolio. This indicator measures the percentage of the total amount of profit, which the company pays to shareholders as dividends.
For example, if the earnings of the individual company are $300 million and it distributes $120 in dividends, then the payout ratio of the firm will be 40%. In general, it goes without saying that every financial expert and commentator have has his or her own views on the subject. However, the general consensus here is that if the payout ratio is at 50% or below, then the company’s dividends are considered to be quite secure.
At the same time, if this indicator falls between 50% to 80% range, then in general it is considered to be satisfactory, as it is perceived that the firm will likely be able to maintain its payouts to shareholders.
On the other hand, if the payout ratio is higher than 80%, then many market participants and financial commentators believe that in those cases the dividend payouts are simply unsustainable. This is especially true if this ratio is higher than 100%. In this case, it means that the firm pays more money to shareholders than its entire annual profit. It goes without saying that this is not a sustainable business strategy. Therefore, in those cases, it is highly likely that at some point the management will decide to cut dividends or eliminate them entirely.
Consequently, when choosing stocks for dividend income and for the equity portfolio diversification it is very important to buy only those securities which have their payout ratios at 80% or lower. With those companies, the management still has enough margin of safety to deal with any surprises on the downside.
However, here it is worth noting that even if the stock has a payout ratio at 80% or lower, it does not necessarily guarantee that the company in question will always deliver consistent dividend payments to shareholders. With some firms, the management might still decide to reduce its payouts due to financial concerns or a number of other types of reasons. This is why it is important to take a look at the dividend payment history of the company in question, as well as analyzing other indicators mentioned above.
Current Valuations
If the stock in question successfully passes all of the tests outlined above, it still does not mean that the income investor should necessarily go ahead and invest in a stock. The fact of the matter is that the stock valuation is an important factor in the due diligence process. After all, an investor might find a decent dividend-paying stock, but if it is extremely overvalued, then the market participant can suffer some serious losses when the market correction takes place.
One of the most popular measures, used in stock valuation, is the so-called price to earnings ratio, also known as the P/E ratio. As the name implies, this is calculated by dividing the current stock price on the earnings per share (EPS) indicator. For example, if the current share price is $30 and the EPS stands at $1.20, then the P/E ratio will be at 25.
Just like with other indicators, every financial expert and an experienced professional investor might have his or her opinions about this indicator. However, the general consensus seems to be that if the P/E ratio of the individual stock is within 15 to 20 range, then it is generally regarded as fairly valued.
At the same time if the price to earnings ratio is higher than 20, then many market participants believe it to be overpriced. Finally, if the P/E ratio of the security is below 15, then it is regarded as undervalued.
The People, aiming at accumulating portfolio income by investing in the solid dividend-paying stocks should give preference to those stocks which have a P/E ratio at 20 or lower. Ideally, it is even better to find those securities which have their price to earnings ratios at 15 or even lower, since in many cases they might represent the undervalued opportunities.
However, at this point, it is worth noting that the numbers we outline here simply represent a rule of thumb, rather than a mandatory rule since it is important for the market participants to maintain a certain degree of flexibility with investing.
For example, if an individual finds a stock, which has a very solid track record of dividend payments, going back to more than a decade, if it has a good payout ratio, low beta, and expanding revenues, then one should not simply discard it if it’s P/E ratio is at 20.3 or 21.0.
On the other hand, if the price to earnings ratio of the firm is at 80 or 100, then it might be a sign that the stock is extremely overvalued and it might not be a good idea to buy it, despite some of its positives. In this case, the market participants can be better off by looking for buying opportunities elsewhere.
Dividend Yield
Finally, on our list of important indicators for choosing the decent stocks for income investing, we have the dividend yield. This indicator is calculated by dividing the total annual amount of dividends on the current market share price and is usually expressed as a percentage. In other words, it shows the rate of return in terms of dividends during the first year of investing in a stock.
Returning to our earlier example, by the beginning of September 2020, the Coca-Cola Company (KO) stock traded near the $50 mark. At the same time, as discussed before, the stock pays a dividend worth 41 cents per share on a quarterly basis. So the total annual payout to shareholders is at $1.64.
Therefore the dividend yield of this stock will be 3.28%. Considering that it is higher than the average historical US inflation rate, it seems like a decent return for investment. Now, considering that the US Federal Reserve still holds its rates within 0% to 0.25%, achieving a 3% return or higher seems like a reasonable alternative for investors.
One important thing to remember here is that if the company raises its payout to shareholders in the future, then the effective dividend yield for the investment will rise as well. For example, let us suppose that an individual investor purchased the 1,000 Coca-Cola stocks. So this means that the total invested amount would be the equivalent of $50,000, excluding the commission of the brokerage company and other types of fees, associated with the stock purchase.
Let us further suppose that after 4 years, the firm was in a position to raise its quarterly dividend to 60 cents per share. This will bring the total amount of annual dividends per share at $2.40. This means that for 1,000 shares the total size of the annual dividend payments would equal $2,400. Consequently, the effective dividend yield on the investment will be $2,400 / $50,000, which equals 4.80%. This is considerably higher than the current dividend yield of 3.28%.
So one of the major upsides of investing in those companies which increase their dividends on a consistent basis is the fact that over time the effective yields on those investments can rise considerably. At the same, it might be a good idea for income investors to look for those stocks which have at least a 3% dividend yield or higher. This is because this will make it highly likely that the investor will be compensated for inflation from the very first year of investment.
Just like in the previous case, this number simply represents a rule of thumb, rather than a mandatory requirement. For example, if there is a reasonably priced stock, with a solid track record of dividend payments and with good company management, then one should not necessarily shy away from purchasing the stock, just because the dividend yield is at 2.9%.
At the same time, if the dividend yield of the security is very low, for example at 0.3% or even 1.5%, then it might not be the best choice for income investing. There are several reasons for this. Firstly, the rate of return in those cases will not be high enough to cover the costs associated with inflation and it goes without saying no investor wants its investments to lose their purchasing power due to rising price levels.
In addition to that, it is helpful to note that such low rates of return are available with savings accounts and certificates of deposit. With those investments, the principal amount of the investment is secure. Consequently, the logical question here is: why would someone risk the principal amount of investment, by investing in a stock with the same return as the fixed income instruments? After all, with CDs and other types of deposit, the value of the investment is not subject to day to day market fluctuations.
Therefore, it makes very little sense for the income investor to invest in those stocks which have a very low dividend yield. Now, some people might conclude if the stock is on the opposite end of the spectrum, if it has a very high yield, like 6% or 8%, then it might be a very good deal and consequently a helpful addition to any income portfolio.
Well, in some cases that might be true, but it is very important to mention that this is not always the case. What happens with some firms is that once their revenues decline, the market responds by selling the stock and as a consequence, the price of the security falls. The management might decide to keep the dividend unchanged at previous levels. Consequently, the dividend yield of the firm rises and offers an attractive rate of return for investors.
However, the problem here is that if the financial problems persist for a firm, then the management might decide to cut the dividend or eliminate it entirely. Consequently, it is very important for investors to look at other indicators as well, rather than solely making decisions based on the current dividend yield.
Building Dividend Income Portfolio – Key Takeaways
- The stock market portfolio represents a collection of stocks, which the investor owns. There are different types of portfolios, some market participants aim for growth, while others more focus on earning a passive income. The latter option is attractive to many investors since it enables them to increase their revenues and at some point, it might even be possible to retire early, by utilizing this type of passive income.
- There are several factors the market participant should consider when selecting stocks for an income portfolio. Those include the history of dividend payments, the payout ratio, beta and P/E ratio of a stock, the current dividend yield as well as the current financial situation of the firm. Those pieces of information are widely available not only on the stock news websites but also on annual and quarterly reports of firms as well.
- It is important for investors not to make investment decisions solely based on one indicator, since it can lead to wrong conclusions. Instead, it is a better idea to analyze all of those indicators mentioned above and only afterward make decisions, which stocks to buy and hold for the income portfolio. This approach can certainly reduce the risk exposure of the investor, although it is important to keep in mind that no investment strategy can guarantee a 100% success rate.