Table of content
The money supply is an important economic indicator in Forex trading. There are at least 4 different types of money supply indicators, with each having a different methodology of calculation.
However, despite those differences, one thing to remember here is that the basic economic law of supply and demand does apply to currencies as well. The moderate expansion of the money supply is indeed necessary for economic development. This is because the long term increase in population as well as the growth of the overall value of the goods and services in the economy, does require more money in circulation.
It goes without saying that all experienced traders are aware of the fact that the exchange rates in the Forex markets are primarily dependent upon the relative strength of two currencies.
Consequently, if the money supply of one currency rises much faster than the other, then it is highly likely that this will lead to the depreciation of the currency. On the other hand, if one central bank expands the money supply more slowly than other central banks, one can expect that its currency might make some gains against its peers.
Finally, it is essential to mention that when we analyze the money supply, it is important to keep in mind that it is a long term indicator. The short term fluctuations in this measure might have very little influence on the Forex market. However, in the long term, the money supply can have a significant impact on exchange rates.
What is the Money Supply?
So what does the money supply measure? Well, as mentioned above we have at least 4 indicators for those. Now let us go through each of these in more detail:
- M0 – This is the most simple measure of the money supply. It covers the total value of coins and banknotes in circulation in a given economy.
- M1 – This indicator also covers the value of all coins and banknotes in circulation. However, in addition to that, the M1 also takes into account the traveler’s checks and demand deposits.
- M2 – This measure accounts for all categories included in M1. Also in addition to that, it includes the savings accounts, money market deposit accounts for individuals, and term deposits less than $100,000.
- M3 – In addition to all items mentioned with M2, the M3 takes account of term deposits worth $100,000 or more and institutional money market accounts.
So as we can see here the M3 is the broadest measure of the money supply. Consequently, it is more frequently used in the analysis. Here it is also important to note that what we have described above, shows the method of calculating those indicators in the US.
Yet, the exact details of the methodology of measuring those indicators vary from country to country. For example, in the United Kingdom, the M0, in addition to all banknotes and coins in circulation also includes the bank reserves.
Effect of Money Supply on the Economy
Before moving on describing the effect of Money Supply on trading Forex, it is important to understand the impact of this indicator on the economy of a given country. The fact of the matter is that the purchasing power of any currency in the world is heavily dependent on two factors. Firstly, it is the total value of goods and services in the economy and the money supply.
Here it is important to note that as time goes on the majority of countries expand their gross domestic product (GDP). At the same time, in the long term, the population size of many nations will also expand considerably.

Consequently, over time the total value of goods and services produced in the economy can grow considerably. Obviously, there are some occasional downturns, like recessions. However, with the majority of the world’s nations, the long term rate of economic growth seems to be firmly into positive territory.
Now, in response to this dynamic, the central banks across the world have at least 3 options. Firstly, they can do their best to maintain the money supply unchanged. Now, if the value total of goods and services rises, while the m3 money supply chart remains flat, it can inevitably lead to deflation. The reasoning behind this is that as there is the same amount of money in circulation, chasing the increasing amount of goods, each unit of currency becomes more valuable.
In general, the prospect of deflation and falling prices can sound quite beneficial to consumers and it definitely is for many individuals. However, the obvious problem here is that this is going to bring disaster for governments with huge piles of debts, as well as for individuals with mortgages and other debt obligations.
The fact of the matter is that during deflation, each dollar or any other unit of currency becomes more valuable. This means that the real buying power of debts will expand. This will make the debt much more burdensome for governments and individuals. Therefore this can easily lead to defaults, foreclosures, and even to the sovereign debt crisis.
Obviously, the central banks can try to expand the money supply in line with economic growth. However, there are also several problems with that. Firstly, this requires the accurate forecasting of GDP growth all the time. This is obviously far from guaranteed. The central bank can not directly control the growth rate of GDP either.
Also, there is always a chance that the policymakers might overestimate the rate of economic growth, raising the money supply by lower amounts than necessary. In the case of this scenario, it is easy to imagine the economy slipping to deflation. Now the experience of the Bank of Japan and the Swiss National Bank have shown us many times that sometimes getting out of a deflationary cycle is much more difficult than reducing the rate of inflation to its intended target.
This is why the majority of the world’s central banks choose the third option: to expand the money supply by a higher percentage than the economic growth rate. Here it is worth mentioning that some economists and financial experts, mostly belonging to the Austrian school of economics, simply define inflation as the expansion in the money supply.
It goes without saying that one can always argue about the exact definition of inflation. However, the fact of the matter is that if a given central bank oversees the 6% expansion in the money supply, it does not mean that the inflation rate will also jump to 6%. Usually, in this case, the actual inflation rate can be much lower at 1% to 2%.
So how can this be possible? Well, there can be several reasons for this state of affairs. Firstly, as mentioned before, the actual value of goods and services, produced by the economy is also rising.
Another important factor to mention here is the fact that the M3 expanding by 6%, does not mean that consumers will spend all of this extra money on consumption. Some portion of this capital will inevitably end up on certificates of deposit (CDs), savings accounts, in private safes, or even under mattresses.
Finally, it is important to mention that when it comes to the world’s reserve currencies, like the US dollar, a significant portion of this additional money in circulation is absorbed by the foreign demand, instead of being spent by the American consumers. Actually, those are also the reasons why the quantitative easing by the US Federal Reserve did not lead to massively rising inflation rates in the United States, as some commentators and financial experts were expecting.
Effect of Money Supply on Currency Trading
Since the money supply has such a notable influence on the economy and inflation, its impact inevitably extends to the Forex market. The general principle here is quite simple. Everything else being equal, the currency, the money supply of which rises faster than its peers, tends to depreciate against the other currencies.
The reasoning behind this is the fact that the money supply is a significant and very often the decisive factor in determining the inflation rate of the given currency. As mentioned before, the actual inflation rate is typically lower than the M3 growth rate. However, this does not mean that there is not a strong deal of correlation between those two indicators.

Consequently, when the money supply of one currency expands more rapidly than the others, it eventually loses its purchasing power much faster than its peers. Now, according to the Purchasing Power Parity theory, in the long term currency exchange rates tend to converge around the rate at which equalizes the average prices of goods and services between two countries.
In simpler terms, it means that the currencies with higher inflation rates tend to depreciate against the ones with a lower rate of price level rises.
However, one thing to keep in mind here is the fact that the world’s reserve currencies, especially the US dollar, but also the Euro, the British pound, and the Japanese yen to a certain extent have a natural advantage over the other currencies. As mentioned before, with those currencies some portions of the newly printed money are absorbed by foreign demand. This essentially means that if the US Federal Reserve and the Bank of China decided to try to increase the M3 by exactly the same percentages, eventually, the US dollar might experience a lower rate of inflation then the Chinese yuan.
Obviously, one policy tool which always has a significant impact on the money supply is the quantitative easing programs, also known as the QE. This became very widespread in the aftermath of the 2008 Great Recession.
As the world’s major central banks lowered their interest rates to near-zero levels, they ended up in a so-called liquidity trap. This means that since they were at zero, they could not lower it further.
Now the Bank of Japan and Swiss National Bank still decided to go ahead and move straight into the negative interest rate territory. However, the problem here was that they could not enforce the negative interest rates on consumers and businesses. After all, if the bank starts charging its clients interest rates for deposits, they can simply withdraw the money and avoid those fees. So this policy can have some unintended consequences.
Considering those risks, the US Federal Reserve, the Bank of England, and some other central banks decided to launch quantitative easing programs instead. This typically involved the purchases of the government bonds, as well as some other types of assets.
Price Action of EUR/USD During US Federal Reserve’s QE Program
So at this stage, some people might be wondering what was the effect of money supply on Forex trades with some currency pairs. In order to illustrate this let us take a look at this daily EUR/USD chart:
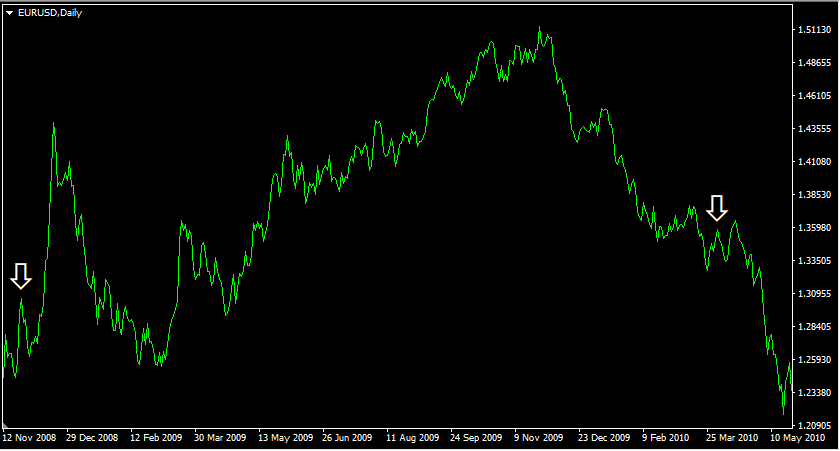
The first white arrow points at the beginning of the first quantitative easing program of the US Federal Reserve, while the second arrow marks its termination. So as we can see from this chart, the EUR/USD pair was trading near $1.25 level, just some days before the announcement. However, at the time, when the US Federal Reserve officially announced the beginning of the program, the pair had already jumped to $1.30.
Obviously, the large scale of the QE program has led to a massive expansion of the US money supply. Consequently, the EUR/USD made some steady gains during the subsequent months, eventually, the exchange rate all the way up to $1.51 level by early December 2009.
Despite this significant move, after this period, the market started the reversal. By the time, the US Federal Reserve announced that the QE program would be terminated, the EUR/USD exchange rate was already down to $1.36 level. However, the strengthening of the US dollar did not end there. During the next several months the pair continued its downward spiral, eventually collapsing all the way down to $1.19 level by June 2010. However, as the US Federal Reserve hinted about the possibility of starting QE2, the Euro began to recover.
Obviously, this was not the only case when the massive expansion in the money supply led to significant moves in the Forex market. For another example, let us take look at yet another daily EUR/USD chart:
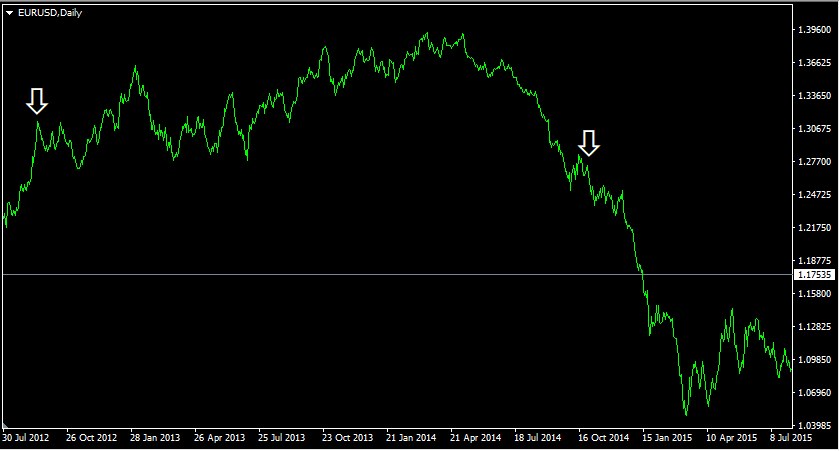
As we can see from the image above, by August 2020, the EUR/USD pair was trading near $1.25 level. In anticipation of the QE3 by the US Federal Reserve, the Euro was making some steady gains. By the time of the actual announcement, the pair has already reached $1.31. After the implementation of those QE measures, the Euro continued with its long term uptrend. In fact, by May 2014, the EUR/USD has reached a multi-year high of $1.39.
However, at this point, it was several months after the US Federal Reserve started tapering the QE program. This basically means that the US policymakers started to incrementally reduce the size of those monthly asset purchases. Consequently, by the second half of 2014, the US dollar has started to gather some strength and make some gains against the Euro, as well as against some other major currencies.
By late October 2014, the US Federal Reserve had already announced the termination of its QE3 program. At that time the EUR/USD pair was already down to $1.27. However, the downward trend kept going on, until the Euro fell all the way down to $1.05 level by March 2015.
So what can we conclude from those examples? Well, after analyzing those cases we can certainly come up with several conclusions:
- The market always tries to make predictions not only about the changes in the interest rates but also about the possibility of implementing quantitative easing measures. Consequently, the currency in question already starts to depreciate before the actual announcement comes out.
- At the early and middle stages of the quantitative easing process, the currency in question tends to lose ground against most of its peers. This is mostly a result of the massive expansion of the money supply, as well as the suppression of the interest rates.
- During the late stages of quantitative easing, sometimes accompanied by the tapering measures, the currency recovers and appreciates against most of its rivals, due to the anticipation of the end of the QE program.
- The strength of the currency also continues after the end of the QE program. One possible explanation for this is that some of the purchased bonds mature and the central receive this invested amount back. This has the effect of reducing the balance sheet and money supply, strengthening the currency in the process.
So as we can see the quantitative easing measures by central banks can have a significant impact on the exchange rates. Consequently, it can be always helpful for traders to research the latest updates on the monetary policy of the world’s major central banks since it can certainly help market participants to make more accurate predictions.
Influence of Money Supply Growth Rate Differentials
We just discussed the impact of quantitative easing programs on the Forex market. However, this does not mean that the influence of the money supply on the exchange rates is just confined to the QE programs.
The fact of the matter is that if there is a significant differential in the money supply growth rates of different currencies, it can have a notable effect on the exchange rate. To illustrate this situation, let us take a look at this EUR/RUB chart:
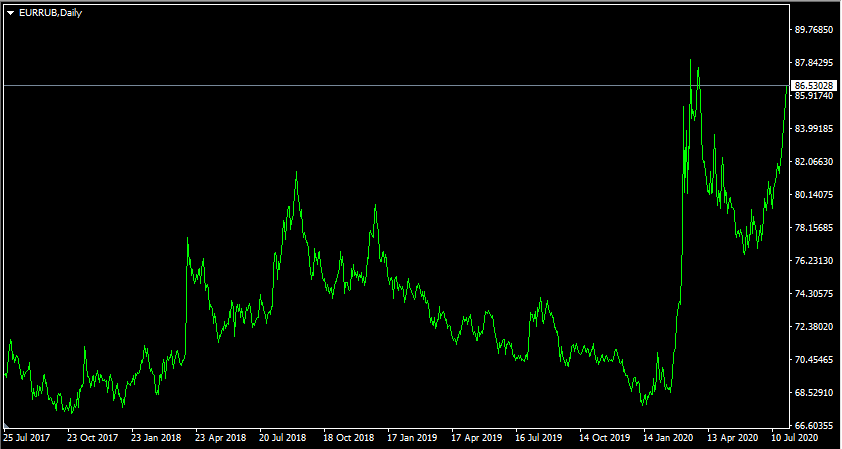
As we can see from the above diagram, 3 years ago the pair was trading close to 69 level. During the subsequent months, the single currency has made considerable gains. The result of this development was the fact that by September 2018, the EUR/RUB pair has already reached 81 level.
After this extreme move, the pair has faced a major correction. During the next several months, the Russian ruble regained its recent losses and by January 2020, the pair was trading close to 68 level. However, this reprieve for the Russian currency eventually turned out to be temporary.
As the oil prices fell dramatically and the COVID-19 pandemic spread around the world, the ruble depreciated rapidly, going all the way up to 88 level during the middle of March 2020. There was a major pullback during the following months, bringing the pair down to 77 level. However, here again, this was a very short-lived tendency. Following another round of interest rate cuts by Bank of Russia, the ruble simply resumed its downward trend, with EUR/RUB reaching 87 mark by the end of July 2020.
Here the decline of the Russian currency after the interest rate cuts seems quite predictable. Here essentially, the Bank of Russia responded to the economic downturn caused by the COVID-19 virus outbreak by cutting the borrowing costs. At the same time, we already know that when a currency losses some of its yields, it becomes less attractive to investors and traders. So that part of the equation seems quite clear.
However, as we have seen from this chart the decline of the ruble exchange rate has not begun in 2020. It is rather a long term phenomenon. So what are we dealing with here? After all, the key interest rate of the European Central Bank has been at 0% for several years now, while the Bank of Russia still keeps rates at 4.25%.
Well, the answer might be in the relative money supply growth rates. According to the official website of the Bank of Russia, during the last 2 years, the growth rate of the money supply in Russia has fluctuated between 7.2% to 14%. Consequently, if we take the midpoint of this range, we will end up with 10.6%, which is indeed quite a high rate of growth.
In contrast to this, during the same period, the growth rate of the money supply in the Eurozone fluctuated between 3.5% to 9.2%. So the midpoint here will be 6.35%. Therefore, as we can see here on average, the growth rate of the Russian money supply is significantly higher than in the Eurozone.
Obviously, this factor alone should give a significant long term advantage to the European currency over the ruble. However, here it is worth remembering that the Euro is the second most popular reserve currency. In fact, according to the latest data provided by the International Monetary Fund (IMF), it makes up more than 20% of the world’s currency reserves.
Consequently, it goes without saying that some portions of this extra money supply will be purchased by governments and individuals across the world and used as a store of value. Therefore, this gives an even stronger long term edge to the Euro in the EUR/RUB pair.
So as we can see from this example, the differentials in the money supply growth rates can have a major impact on the long term currency exchange rate movements. In fact, from the latest example, it seems clear that this factor can even override such important indicators as the relative nominal interest rates. This is essentially how strong the effect of money supply on the trade market is.
Why Sometimes Money Supply Override Nominal Interest Rates?
Before moving on to the concluding remarks, there is one important answer: why in some cases, like one described in EUR/RUB example, the money supply has more influence on the exchange rates than the nominal interest rates?
Well, one logical explanation for this would be the fact that nowadays investors are more concerned with preserving their purchasing power than earning slightly higher interest rates on their deposits. The reason for this is that now all major central banks have their interest rates set at 0.25% or even lower.
Now, this is the case, despite the fact that the majority of developed economies have their average inflation rates within 2% to 3% range. Consequently, investors and traders are faced with negative real interest rates. As mentioned before, the Bank of Russia still keeps rates at 4.25% and there are some other emerging market currencies that offer similar rates of return.
However, the problem here is that the real interest rates of those currencies are also deep into the negative territory since the average inflation rate in those countries is much higher than 4.25%.
Consequently, it is not surprising that for investors any currency which is better at preserving its purchasing power is very attractive. Therefore, the majority of the market participants do give preference to those.
Understanding Money Supply – Key Takeaways
- The money supply is one of the most important long term indicators in the Forex market. It is measured by different indicators such as M0, M1, M2, and M3. Each of them has a different methodology of making calculations. However, in general, M3 seems to be the most comprehensive measure of the money supply. When comparing the money supply indicators of different countries, it is worth noting that each of them might have their own specific set of rules for calculating those items.
- The moderate growth rate for the money supply is essential for the normal functioning of the economy. This is due to the long term growth of the population, as well as due to the expansion of the total value of goods and services, produced by the economy. If the money supply stays flat or falls, it can lead to deflation and an economic downturn. On the other hand, if M3 rises much faster than the recommended levels, it can lead to much higher inflation and devaluation of the currency.
- Everything else being equal, In a given currency pair, the one which has a higher average money supply growth rate tends to depreciate against the other. However, here it is important to remember that the world’s reserve currencies such as the US dollar and the Euro can sometimes avoid depreciation, despite the high growth rate of M3. The reason behind this is that some portion of this additional money supply is absorbed by the foreign demand.