Table of content
The Big Mac index, also known as BMI was first introduced by the British financial magazine ‘Economist’, back in 1986. Since then the index has been updated for at least once per year. In fact for the last several years, the Economist is now publishing those reports with a 6 month intervals.
As the name suggests, the Big Mac index measures the average prices of this most famous McDonald’s product in dozens of different countries on a regular basis. It is worth noting that BMI has several uses for traders and investors.
The original purpose of the invention of the Big Mac index is to identify the relative undervaluation and overvaluation of currencies, based on the purchasing power parity indicator, also known as PPP. The PPP basically represents an exchange rate at which the average prices for goods and services will be equalized between two given countries.
So according to the Big Mac index, currencies which trade below the PPP level are considered to be undervalued and are likely to appreciate in the long term against other currencies. At the same time, currencies that trade above PPP are deemed to be overvalued and are likely to depreciate against their peers in the future. Consequently, traders can use the Big Mac index to identify and sell overvalued currencies and buy the undervalued ones.
It goes without saying that the BMI can be a handy tool for currency valuations. However, it is worth mentioning that it also has other uses as well. For example, some financial experts and commentators are using the Big Mac index as an alternative measurement for inflation. In fact, the comparison shows that the inflation rate according to the BMI is slightly higher compared to the Consumer Price Index.
In addition to that, some financial commentators are actually using the Big Mac index to compare the wage levels in different countries. For example, some people research how many hours an average employee has to work in a given country for he or she to be able to buy one Big Mac.
Finally, some people also use the Big Mac index for investing, while making their personal finance calculations. This includes things such as calculating net worth or to visualize the effects of inflation on the mortgage balances as well as for other purposes.
So as we can see the Big Mac index has at least 4 major uses. So let us go through each of them in more detail.
Big Mac as a Measuring Rod
As mentioned above, the main reason why the Economist came up with the Big Mac index was to come up with some measurement for currency valuations. After all, currency exchange rates are quite volatile and without any standard of measurement, it is very difficult to tell, which ones are undervalued and which ones are overpriced.
Consequently, the Economist started measuring the price of Big Macs in several countries. Here it is worth noting that the British financial magazine does not rely on the prices of one single restaurant. Instead, they track prices of all McDonalds’ restaurants in several cities and then come up with the average price for the given country.
For example, when the Economist’s employees are collecting their data for the United States, they measure the average price of the Big Mac in the four largest cities in the country: New York, Chicago, Atlanta, and San Francisco. After collecting this data, they then come up with the average price for those 4 largest cities and publish it in their annual report.
The possible reasons why the Economist has chosen the price of Big Mac as a measuring rod are several. Firstly, it is important to keep in mind that this product is produced in dozens of different countries by the same company. Consequently, it is easier to identify it and distinguish it from other products.
For example, if the Economist has chosen bread instead for this purpose then the task of collecting data would be much more difficult. The reason behind this is the fact that there are dozens of different bread types produced by hundreds of different companies. On the other hand, with the Big Mac index, the Economist’s employees can simply walk in the local McDonalds’ restaurant and take note of the latest prices.
In addition to that, it is worth noting that Big Mac is a well-known product across the world. It is an affordable good and there are millions of people who consume it on a regular basis.
Finally, it is helpful to mention that the price of Big Mac itself represents some sort of basket of goods and services. It includes the price of bread, cheese, onions, pickles, beef, vinegar, mayonnaise, as well as the cost of transportation, utilities, rent, labor, and taxes.
So instead of monitoring the prices of all those goods and services and give them different weights in the index, people simply can take a look at the price tag of the Big Mac to get the latest update on the change in the average price of this type of consumer basket.
Obviously, there can be some differences in the composition of this product in different countries. However, this does not change the fact that the Big Mac is the most famous brand of Mcdonald’s across the world. So those are the likely reasons why the Economist has chosen this product as a measuring rod for its index.
Currency Valuations
At this stage, some people might ask a very obvious question: what does the Big Mac index have to do with the currency valuations in the Forex market? Well, here it is worth remembering that we have the purchasing power parity theory when it comes to valuing different currencies.
As this theory suggests, in the long term, the currency exchange rates tend to gravitate towards the PPP rate. This essentially represents the exchange rate at which the average prices of goods and services will be equalized in two given countries.
The rationale behind this is very simple. If the currency of a given country trades below the PPP level, it means that the prices of goods and services in the nation are cheaper compared to many other countries. Consequently, this will make its products more attractive to foreign importers. As a result, the demand for those goods and services will increase, pushing the exchange rate higher in the process.
At the same time, if the currency trades above the PPP level, then the country’s products are more expensive and less attractive for foreigners, leading to a long term decline of the exchange rate.
So how does this theory work in practice? Well, we can take a look at a couple of examples, where predictions produced by the Big Mac index turned out to be accurate. Firstly, let us take a look at this weekly GBP/USD chart:
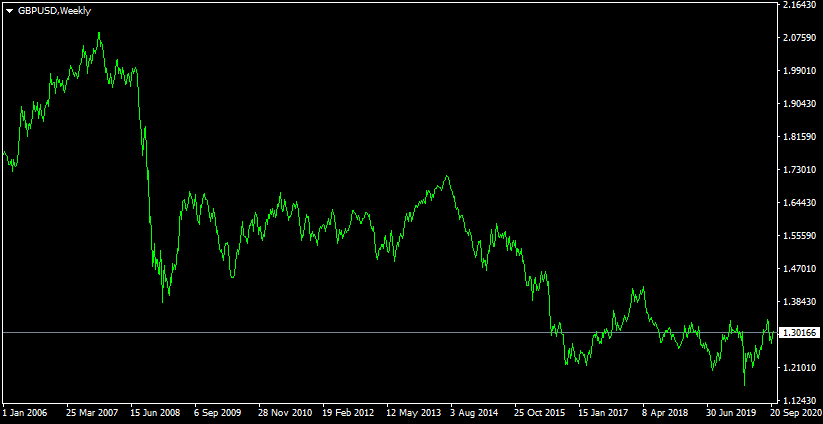
As we can see from the above image, at the beginning of 2006, the pound was trading close to the $1.75 level. During the subsequent years, the British currency has made some additional gains against the US dollar. By July 2008, the GBP/USD exchange rate was near the $2.00 mark.
At that time, according to the Big Mac index, the average price of Big Mac in the United States four largest cities stood at $3.57. At the same time, in the United Kingdom, the average price of this product was at £2.29. So this means that the PPP level, or fair value for GBP/USD pair, was at 3.57 / 2.29, which approximately equals 1.56.
In other words, the British pound was trading 28% higher than the PPP level. So this means that in July 2008, the pound was 28% overvalued against the US dollar.
As we can observe from this diagram, this valuation turned out to be accurate. From late July 2008, the UK currency began its sharp decline, eventually dropping all the way down to the $1.38 level by January 2020.
After this sort of panic selling has ended, the GBP/USD pair started to stabilize and during the next subsequent years, the pair mostly moved within the $1.50 to $1.65 range, not very far from the PPP levels.
This pattern was only disturbed after the 2016 EU referendum in the United Kingdom. Due to the economic uncertainty, brought by the outcome of this event. As a result, the pound has entered an extended period of undervaluation, trading near the $1.30 level by October 2020.
Extreme Cases of Overvaluation
If the case of the British pound trading well above the PPP level in 2008 was surprising, it is worth noting that we have even more extreme cases of currency overvaluation. In order to illustrate one of such cases, let us take a look at this weekly USD/NOK chart:
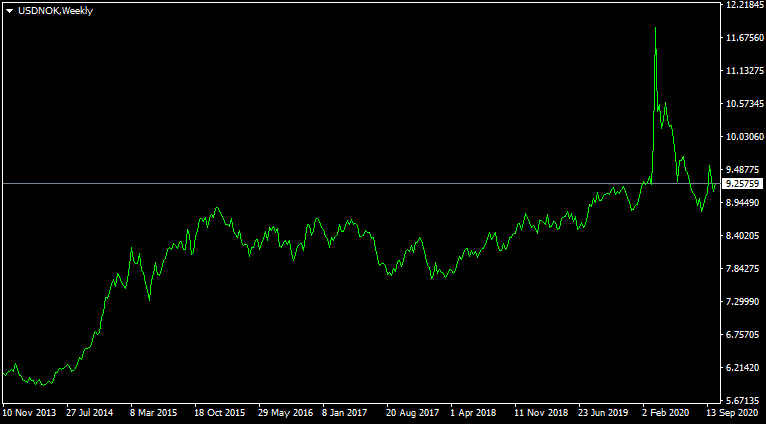
As we can observe from the above diagram, back in Spring 2014, the USD/NOK exchange rate was close to the 5.90 level. At that time the average price of Big Mac in the US stood at $4.62, while in Norway it was at 48 kr. Consequently, according to the Big Mac index, the fair value for the USD/NOK pair was at 48 / 4.62, which is 10.39.
This suggested that at the current market exchange rates, the Norwegian Krone was approximately 76% overvalued against the US dollar. Therefore, it meant that the USD/NOK pair was due for some major correction.
The catalyst for this type of correction was the drop in oil prices from the second half of 2014. It is a well-known fact that Norway is one of the largest producers and exporters of this commodity in the world. Consequently, the large drop in oil prices led to the loss of revenue for the Norwegian oil producers. As a result, the Norwegian government also lost some of its tax revenues.
It is not surprising that since the second half of 2014, the Norwegian krone started losing ground against the major currencies. In fact, by January 2016, the US dollar was already trading well above the 8.80 level against the Norwegian gains. After making some additional steady gains, the USD/NOK pair has reached the 9.30 level by October 2020.
At that time the PPP level according to the Big Mac index has already shifted considerably, reaching 9.37 level. So as we can see the actual exchange rate and PPP implied rate, were we close to each other by October 2020.
How to Trade and Invest according to the Big Mac Index?
At this stage, the obvious question is: how traders and investors can utilize the Big Mac index? Well, the first thing to realize here is that the Big Mac index is a long term indicator. As we have seen from the two previous examples, it took some time for the exchange rate to adjust itself according to PPP. In fact, in some cases, this process might take some months or even more than a year to be fully completed.
The reality of the matter is that some currencies can remain at undervalued or overvalued levels for an extended period of time for a variety of reasons. For example, some currencies might have a high interest rate, which might attract some traders and investors, keeping it on overvalued levels for an extended period of time.
On the other hand, we have seen an example of the British pound, which from the second half of 2016 has remained at undervalued levels against the US dollar, the Euro, and some other major currencies. One of the main reasons for this was the economic downturn and uncertainty brought by Brexit.
Therefore, the Big Mac index is not that useful for scalpers and day traders. The fact of the matter is that the purchasing power parity dynamics has very little influence on the exchange rates with such a short timeframe. Consequently, those types of traders are generally better off checking out short term technical indicators, rather than focusing on PPP.
In fact, the Big Mac index might not be that helpful for swing traders either. Those types of traders keep positions open from several days to several weeks. However, as we have seen from the above examples, it might take much more time for the market to make adjustments according to currency valuations. So just a couple of weeks might not be enough for the market to make such a move to benefit those traders.
So it goes without saying that the Big Mac index is most useful for long term traders. The basic method of trading BMI is very simple. Traders can simply visit the Big Mac index page at the economist’s website and create the list of most undervalued and overvalued currencies.
After that, once traders compile the list of most overvalued and undervalued currencies, they can move to the next stage. Here they can start considering buying the undervalued currencies and selling the overvalued ones. Once those currencies get close to the PPP level, traders can close those positions, earning some payouts in the process.
Two Types of Big Mac Index
One thing to take note of here is that there are two sets of BMIs. The basic index makes its calculation solely by average Big Mac prices in different countries. On the other hand, there is also the GDP adjusted index. As the name suggests this type of BMI index takes into account the GDP per capita indicator on its calculations.
Generally speaking, the raw index works well when valuing currency pairs, composed entirely of currencies representing developed economists. This is because the degrees of economic development in those countries are quite close to each other. Consequently, the direct comparisons of the price levels of goods and services between those nations generally tend to be accurate.
On the other hand, the GDP per capita adjusted index is especially helpful when valuing the emerging market currencies. This is because the prices for products and services in developing economies are cheaper than in developed countries. This is because generally speaking people in those countries have much less disposable income to spend on goods and services.
Consequently, comparing the price levels directly between those two types of countries can be very misleading. Consequently, it is a much better idea to take the GDP per capita differential into the account, when making those types of comparisons.
Need for Alternative Measure of Inflation
As mentioned before, the Big Mac index is also used as an alternative measurement of inflation. However, the obvious question here is: why would some people look for alternative measurements of inflation? Well, It is a well-known fact that for decades the consumer price index, also known as CPI has been the most popular and frequently used measure of inflation.
In fact, the majority of the world’s central banks are using CPI as a reference point to measure whether or not their inflation rate is on the target according to their mandate of price stability.
However, the consumer price index has also come under criticism, from several financial experts, including Peter Schiff, the Chief Financial Officer and founder of Euro Pacific Capital. They argue that the methodology of the index is constructed in a way that it constantly understates the inflation rate.
There are several reasons for this. Firstly, we have so-called substitution adjustments. In simple terms, it means that statisticians measuring the CPI are assuming that over time consumers will switch from buying items that become more expensive to items the prices of which remain stable or expand at a lesser pace.
For example, let us suppose that we have two types of milk A and B. Let us further suppose that the price of A type milk rises by 9%, while the cost of B type milk increases by 1%. So what will be the average rate of inflation?
Well, the calculations here will be quite simple. If we add up 1% and 9% together and divide it into 2, we will end up with 5%. So the average inflation rate here will be 5%.
However, this is not how CPI is calculated. Instead, the statisticians measuring this indicator might assume that since the price of B type milk is rising more slowly than A type milk, then the majority of consumers will switch to that product. So they might give 0.2 weight to A type milk and 0.8 weight to B type milk.
Consequently, the inflation rate here will be 3.2%, which is considerably lower than in the previous case.
It is also worth noting that CPI also uses so-called hedonic adjustments. This essentially means that the inflation rates with products are reduced to account for their improved quality over time.
Finally, some people also criticize CPI for giving too small weight to foods and beverages, which is around 15% compared to housing, which represents 41% of the index.
Due to all those imperfections of the consumer price index, some people are looking for alternative measurements of inflation. One of those alternatives is the Big Mac index.
Big Mac Index as an Alternative Measure for Inflation
At this stage, some people might wonder what makes the Big Mac index an interesting alternative measure for inflation. Well, the fact of the matter is that the BMI itself represents a basket of consumer goods and services, such as:
- Bread
- Cheese
- Beef
- Pickles
- Unions
- Lettuce
- Mayonnaise
- Sesame Seeds
- Vinegar
- Pepper
- Olive Oil
- Mustard
- Garlic
- Paprika
- Rent
- Electricity
- Transportation
- Taxes
So as we can see here the Big Mac index represents a basket of 20 different goods and services. Consequently, this does include many products that people consume on a daily basis.
In addition to that, it is worth noting that there are no substitution or hedonic adjustments involved when calculating a Big Mac index. Simply speaking, McDonald’s adjusts its Big Mac price across the world, according to the cost of raw materials and wages, taxes, and other expenditures. This corporation has no incentive to keep the prices of its products artificially down, just to understate the inflation rate. Therefore, for some people, BMI is considered to be a reliable source of information regarding the latest inflationary trends.
It is also helpful that the method of calculating this index is quite transparent and simple. The fact of the matter is that one does not have to go through the complex statistical formulas in order to understand how the index is calculated. The index simply takes the prices of Big Mac at dozens of different locations in the given country and comes up with a simple average. So it is very simple to understand and digest.
Long Term Effects of Inflation Differentials
Before moving on to the other advantages of using the Big Mac index, it is important to point out that the inflation differentials between two given currencies can have a major long term effect on the exchange rates. The one thing to realize here is that the purchasing power parity is not some sort of static indicator. Instead, over time it tends to shift in favor of the currency which has lower inflation rates.
For example, back in 2000, the average price of Big Mac in the United States stood at $2.51, at the same time, in Switzerland the cost of this product was at 5.90 Swiss francs. After 20 years, the situation has changed considerably. In the United States, the average price of Big Mac has risen to $5.70. At the same time, there was also some price increase in Switzerland, with the cost of Big Mac rising to 6.50 Swiss franc. As we can notice here, the inflation rate according to the BMI was considerably higher in the United States than in Switzerland.
This had a significant impact on the PPP levels as well. The fact of the matter is that back in 2000, the fair value for the USD/CHF pair was at 5.90 / 2.51, which is 2.35. As we have seen above, by 2020, things have changed considerably. By 2020 the fair value of USD/CHF according to the Big Mac index is at 6.50 / 5.70, which is 1.14.
This means that the fair value for the pair is still above the parity level. However, we can also notice that during those two decades the purchasing power parity has shifted significantly in favor of the Swiss franc. In fact, if the current trends persist in the future, after some years, it is likely that the fair value for USD/CHF might be below the parity level.
We can see this reflected on USD/CHF exchange rates as well:

As we can see from the above chart, the USD/CHF exchange rate has been in a long term downward trend since 2000. The main reason for those developments is the fact that in Switzerland the inflation rates were consistently lower than in the US. In fact, since the 2008 financial crisis, the price levels in the country have remained flat. So it is not surprising that over the years, the Swiss franc has improved its position against the other currencies.
On the other hand, the US dollar has gained a lot of ground in terms of PPP against some emerging market currencies, where the inflation rates are considerably higher than in the United States. For example, back in 2000, the average price of Big Mac in Russia was 39.50 roubles.
So the PPP level for the USD/RUB currency pair was at 15.74. However, by 2020, the price of Big Mac in Russia has risen all the way up to 135 roubles. Consequently, the fair value for USD/RUB pairs has risen to 23.68, in favor of the US dollar.
Therefore, as we can see from the above examples, in the long term the PPP levels and the exchange rates generally tend to shift in favor of the currencies, which have lower inflation rates compared to its peers.
Comparing Living Standards in Different Countries
It is with pointing out that some financial analysts and commentators are using the Big Mac index to compare living standards in different cities. They do so by calculating how many hours or minutes an average worker has to work in order to earn enough money to afford one Big Mac.
For example, back in 2015, the Swiss Bank UBS has published research covering this topic. According to this research paper, it only took approximately 9 minutes of work for an average worker in Hong Kong to afford one Big Mac. At the same time, in Tokyo, Japan this number stood at nearly 10 minutes. In Miami, United States, it took 11 minutes of work to afford one Big Mac.
On the other end of the spectrum, we have Nairobi, a capital city of Kenya, where workers have to work for around 173 minutes for them to earn enough money to afford at least one Big Mac.
This sort of comparison is handy for analysis because comparing salaries in different countries in one currency is not really an apple to apple comparison. It is true that in rich countries, people generally tend to have higher incomes than in developing countries. Yet, it is important to keep in mind that the cost of living there also tends to be higher than in the emerging market economies.
So if we just start comparing salaries in US dollars, in Euros, or in other currencies, the result can be misleading, since we will not be taking into the account the different price levels in those two places. On the other hand, if we use the Big Mac index for this purpose it can present us with a more accurate picture.
Therefore, the main idea here is very simple: less time of work an individual needs to earn enough money to buy one Big Mac, the higher the living standards in a given city. The opposite is also true. If an average worker needs to spend hours at work just to earn enough money to afford one Big Mac, it only suggests that the living standards in a given city are quite low.
Use of Big Mac Index in Investing
Before moving on to the concluding remarks it is important to mention that the Big Mac index can also be used in investing. Firstly, by knowing which currencies are undervalued, investors look for stocks or real estate which pays dividends or rents in that particular currency.
This approach has two distinct benefits. Firstly, it is important to mention that because the currency is undervalued, the price of stock or property is likely to be at a discount. Therefore, there is potential for capital appreciation at some point in the future.
In addition to that, investors can benefit from potential currency appreciation and receive higher rents and dividends along the way.
Here it is also worth mentioning that because of its use as an alternative measure of inflation, investors can use the Big Mac index to measure what rate of return they need to achieve from investing in order to preserve and hopefully increase their purchasing power.
Finally, investors can use the Big Mac index to calculate the changing purchasing power of their mortgage balances and other liabilities. For example, let us suppose that over several years an individual investor has reduced the mortgage balance from $100,000 to $90,000. At the same time, let us further suppose that according to BMI, at the time of the initiation of the loan 1 Big Mac was worth $5.00, while now the price has risen to $5.70. Does this mean that the liabilities have fallen by 10%?
Well, in nominal terms yes, since $10,000 represents 10% of $100,000. However, in real terms that is not the case. In order to understand this better, let us go back in time. When the mortgage was initiated, the client had borrowed $100,000, which at that time bought 20,000 Big Macs.
However, we know that at the moment the remaining mortgage balance stands at $90,000, which can buy 15,789 Big Macs. So this means that the purchasing power of the mortgage has dropped by more than 21% due to repayments as well as inflation.
So as we can see from this example, investors can use the Big Mac index to simplify calculations regarding the current purchasing power of investments and liabilities.
Imperfections of Big Mac Index
As we have seen from the above examples, the Big Mac index has many uses and can be a handy tool for traders and investors. Now, despite all of those advantages, it is important to mention that just like any other indicator, the Big Mac index does have some imperfections as well.
Here it is worth remembering that as mentioned before, this index is a long term indicator and is not that useful for short term trading. The reality of the matter is that for the predictions based on the Big Mac index to materialize it might take several months or even more than a year, consequently, this indicator is not very helpful for scalpers, day traders as well as for swing traders.
Consequently, if a trader wants to open positions with just a 15 minute timeframe to earn 5 or 10 pips in a process, he or she can not simply turn to the Big Mac index for guidance. On the other hand, if the market participant is considering opening a long term trade, then the BMI can offer some guidance regarding the potentially undervalued and overvalued currencies.
In addition to that, it is helpful to keep in mind that the Big Mac index is not updated on a monthly basis, just like other indicators like the consumer price index or the unemployment rate. Instead, the latest reports are usually published only twice per year. Consequently, traders and investors have to wait until January or July, before they can get their hands on the latest report of the Big Mac index.
Trading and Investing According to Big Mac Index – Key Takeaways
- The Big Mac index was introduced by the British financial magazine the Economist back in 1986. It measures the average prices of the Big Mac in dozens of different countries. The main purpose of the index is to calculate the relative overvaluation and undervaluation of currencies according to the purchasing power parity theory. The index is usually updated two per year during January and July.
- The Big Mac index is a long term indicator. It is not very useful for scalpers and day traders. On the other hand, long term traders can utilize this index by buying the currencies which trade above the PPP level and therefore are considered to be undervalued. At the same time, the market participants can sell those currencies which trade above the PPP and consequently are considered to be overpriced.
- Some financial experts and commentators are also using the Big Mac index as an alternative measure of the inflation rate. The fact of the matter is that some people believe that the consumer price index, also known as the CPI is not very accurate and generally tends to understate the inflation rate. On the other hand, the Big Mac price essentially represents the fixed consumer basket of 20 goods and services, and its calculation method is quite simple. So it became an attractive alternative for CPI for some market participants.