Table of content
For several decades now, the consumer price index, also known as the CPI, has been one of the most well-known and frequently used ways to measure inflation. This indicator tracks the prices of thousands of goods and services. After gathering all the data and applying the weights to each category, the statistics agency comes up with the rate of overall price level changes during the last month and also during the last 12 month period.
In fact, even nowadays the majority of the world’s central banks have some sort of target for this indicator. If the CPI diverges from its intended goal significantly, then the policymakers respond to this by lowering or raising interest rates and using other tools at their disposal.
Despite its apparent popularity, the consumer price index does have its fair share of critics and skeptics. Some financial experts and commentators argue that the CPI is designed in a way to understate the rate of inflation. Consequently, in order to protect one’s purchasing power, they advise investors and economists to start calculating inflation with alternate methods.
There are several options to do this. Firstly, market participants can calculate inflation with GDP deflator. This indicator measures the average price changes of all goods and services produced in the economy.
Another alternative way to measure inflation was introduced by the so-called Billion Prices Project. It tracks down the prices of thousands of goods of online retailers.
Finally, some financial experts and commentators during the last decade started using the Big Mac index, published by the British magazine the ‘Economist’. This measure tracks the average price of this famous McDonald’s product in dozens of countries and updates it on a regular basis since 1986.
It has to be mentioned that each of those inflation calculating alternate methods does have their advantages and drawbacks. Obviously, nobody can guarantee that any of those are 100% accurate measures of inflation. However, they can be really useful for those traders and investors who do not trust CPI, or just want to research some additional methods of tracking price level changes.
Why do Some People Criticize CPI?
Before moving on describing all of the details of each alternative inflation measure, we need to answer the obvious question. Why would someone criticize CPI and look for other measures of price changes?
Well, in order to answer this question, we need to take a look at the possible flaws and imperfections of the consumer price index. As mentioned before, the general perception of the significant portion of the American public, as well as that of many other countries around the world is that CPI understates inflation.
This criticism became especially frequent in the aftermath of the 2008 Great Recession. At that time many US consumers complained that their living costs increased considerably, while the official CPI only showed from 1% to 3% inflation rate most of the time. So how can this be possible? Well, there are several reasons why the CPI might be understanding inflation.
Firstly, the composition itself of the index itself can be a subject of controversy. The fact of the matter is that the CPI does not apply equal weight to all goods and services, but each of those is given different percentages. For example, the Food and Beverages category only accounts for approximately 15% of CPI.
This means that if the prices of those items rise considerably, its overall impact on the CPI might be quite small. For example, if the prices on Foods and Beverages rises by 6%, this will increase the CPI by only 0.9%.
For the weights of other categories in the CPI, let us take a look at this chart:
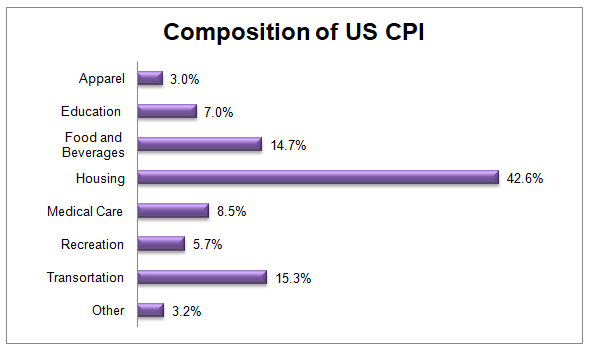
As we can see from the above diagram, the housing sector accounts for the largest component, making up more than 42% of CPI. While the transportation category represents the second largest component, composing more than 15% of the index.
The fact that the Food and Beverages category is only at the third largest component and roughly 3 times smaller than the housing sector does attract criticism in some cycles. It goes without saying that the significant portion of the population, especially lower income households, spend a considerably larger portion of their incomes on groceries than just 15%.
The second controversial topic is the use of ‘hedonic adjustments’ in the measuring inflation formula. Now, this might sound rather a complicated term, but its underlying principle is very simple. This means that the statistics agencies are making quality adjustments on a range of products.
For example, if the price of a new model mobile phone is 5% higher than that of the older model, then the statisticians might not report 5% inflation in this category. Instead, they might decide to reduce it by 2.5% for quality adjustment purposes and only account for a 2.5% increase. The line of reasoning here is that this new product is of higher quality and therefore it should cost more money.
Another method, statisticians use when measuring the inflation rate is the use of substitution. This means that if from two similar products, the price of one rises faster than the other, then the statistics agency will assume that many people will move on to cheaper goods and give it greater weight.
For example, let us suppose that the supermarket has just two types of frozen steak and let us call them A and B. The A type steak costs $3.00 and the price of B type is $4.00. After the passing of the one year, the price of A type steak has risen to $3.06, while the cost of buying B type steak has risen to $4.40. So what will be the inflation rate in this product category?
Well, the answer to this question seems quite straightforward. The price of A steak has risen by 2% and in the case of B steak, it has increased by 10%. So the average rate of this price increase is 6%. Therefore, the inflation rate should be 6%.
This is true, but in the case of the substitution method, the statistics agency might decide to give 80% weight to A type steak and 20% weight to B type steak. This is because the statisticians in this case assume that people will switch to cheaper products. As a result, instead of 6%, the inflation rate in this category is 3.6%, by using this method.
Due to all those reasons, a significant portion of the consumer, as well as economists and investors believe that the CPI might not be the most reliable tool for measuring changes in the overall price levels and they look for the alternative measure of consumer price inflation.
GDP Deflator as Alternative Inflation Measure
When discussing the possibility of alternate measures of inflation, the first thing which comes in mind is the GDP deflator. This indicator tracks the average price changes of all goods and services produced by the economy.
This measure is used by the statistics agencies around the world to calculate the real GDP. After calculating the value of the nominal GDP of a given country, they use the deflator in order to adjust this number for the inflation.

This indicator does have several advantages. Firstly, it covers a wider range of goods and services, than CPI. In this case, the statisticians do not pick and choose which types of products consumers buy the most and give different weights to each of those. Instead, the GDP deflator takes into account all of the products and services produced by the country. Consequently, this makes the GDP deflator a more comprehensive and informative measure.
Another obvious benefit of using this measure is that it does not employ the substitution adjustments, but simply tracks the prices of thousands of goods and services as they stand. This method can certainly improve the reliability of this inflation indicator.
Now, despite all of the benefits of using the GDP deflator, It does have one major weakness. The fact of the matter is that this indicator only tracks domestically produced goods and services. However, nearly every country imports a significant amount of products from abroad. Even the businesses from some of the most self-sufficient nations import some goods in order to improve the variety of choices for their consumers and increase their sales.
Consequently, consumers nearly all of the countries in the world spend a considerable portion of their income on imported products. Therefore, calculating the inflation rate solely on domestically produced goods and services can be sometimes misleading.
Another obvious drawback of this indicator is the fact that its inflation measurement is still quite complicated. An individual needs to have a database of thousands of goods and services in the country, which is obviously very difficult to achieve and requires significant administrative expenses. Therefore people outside of the official statistics agencies might not be able to verify the reliability of GDP deflator.
Tracking Retail Prices
The ordinary individuals and some academics tried to measure inflation by keeping track of day to day retail prices. One of the most obvious examples of this is the so-called billion prices project. This tracks the prices of thousands of products, sold by online retailers.
This method does have its fair share of advantages. Firstly, such methods for calculating inflation seem quite fair and accurate. In this case, all products are given equal weight and also there is no substitution or hedonic adjustment methods to worry about.
All statisticians need here is, to sum up, the total costs of this large basket of thousands of products and compare it to the previous measurement period. The percentage increase will represent the level of inflation. So as we can see the methodology is quite straightforward and does not need an application of some complex formulas.
Another major benefit of this method of measuring inflation is the fact that the administrative costs of making such calculations are not that high. In fact, one can do similar research on an individual level. For example, some people do draw the list of 10, 20, or any other number of most frequently purchased items by their family and keep track of changes in those prices on a regular basis.
So the advantage of this method is that one can conduct similar research in his or her spare time. The fact of the matter is that a consumer does not need to rely on the statistical agencies in order to make those calculations.
Now, obvious just like any other method of measuring inflations, this approach does have some imperfections as well. The first downside is that this method does not cover some of the spending categories. For example, consumers spend thousands of dollars on rent or mortgage expenses, however the retail price calculations do not include this category. Another important item is fuel costs, which are also not included in this measure.
Obviously, one solution to those problems is for consumers to start recording their rent, mortgage, and fuel expenses and incorporate it into their inflation calculations. However, it goes without saying that recording all those expenses and retail prices can be time consuming for some people.
So those individuals who are very busy with their work and other aspects of their lives might prefer to have an inflation measure, which is already calculated, rather than spending time measuring it.
Big Mac Index as Measure of Inflation
The Big Mac index was introduced by the British magazine ‘Economist’ back in 1986. Since then it is regularly published on an annual and later even on a semi-annual basis. It measures the average prices of this product in dozens of countries.
Here it has to be mentioned that the main purpose of this invention was not to measure inflation. Instead, the ‘Economist’ started measuring those prices in order to determine the Purchasing Power Parity level for different currencies. This helped the commentators at this journal to evaluate the undervaluation and overvaluation of currencies.

However, because of the fact that we now have 34 years’ worth of price data, some financial experts and commentators started using this index as some sort of guide to inflation. For example, Peter Schiff, the famous financial expert who predicted the 2008 Great Recession and the Chief Executive Officer of Euro Pacific Capital has referenced the Big Mac Index, in some of his analyses, when discussing the inflationary dynamics in the US.
So why would someone consider using BMI as some sort of measure for inflation? Well, the fact of the matter is that this index itself in a way represents the basket of goods and services. The Big Mac Index includes the price of bread, mayonnaise, vinegar, mustard, sesame seeds, olive oil, cheese, lettuce, onion, beef, cucumber, as well as the cost of labor, electricity, transportation, rent, and taxes. So as we can see this measure includes the cost of at least 16 goods and services.
Therefore, Forex traders, as well as investors can simply compare the current price with that of the previous year and come up with the inflation rate. It goes without saying that this indicator does have some benefits. Firstly, it represents the fixed basket of goods and services, free of any substitutions or hedonic adjustments. This obviously makes the indicator more reliable.
The second advantage of using such ways to calculate inflation is the fact that its measurements are very simple and transparent. All people need to do is keep track of the price of one item. The history of the price changes is also helpfully posted at the ‘Economists’ website as well.
So one does not need to go through the complex calculations or record the prices of thousands of products, in order to calculate the BMI inflation rate. One can even construct the alternate inflation charts using this indicator, without spending hours in front of the computer.
Another benefit of using BMI is the fact that it is not limited to one particular country. Instead, traders and investors can use this measure to get some idea about the inflationary dynamics of dozens of different countries and currencies.
Finally, the Big Mac Index can be also a handy tool for making a quick comparison of long term price changes between different periods and countries over the last 34 years.
Just like in all previous cases this indicator is not without its imperfections. The fact of the matter is that compared to other alternative inflation measures, this indicator measures a relatively fewer number of goods and services. Obviously, this a tradeoff, for having a quick and simple reference point for inflation.
Practical Application of Alternative Inflation Measures
At this stage, many people might wonder how those alternative inflation measures compare with the official consumer price index. Starting from the long term analysis, according to the CPI figures, the average annual rate of inflation in the United States from 1986 until 2020, currently stands at 2.6%. In contrast to those numbers, according to the ‘Economist’ Big Mac index, the average US inflation rate during the same period is at 3.8%.
This suggests that in the long term, the US CPI might underestimate the level of annual inflation by 1.2%. This seems quite believable because of several reasons. Firstly, this result does address the complaint of consumers that official CPI understates inflation.
Secondly, the difference between those two measures is not so large to make it seem unrealistic. For example, there are some commentators or analysts which suggest that the real inflation rate in the US is above 10%. However, this seems quite unbelievable. After all, if that was the case the bonds investors would have demanded much higher returns than before. Also, the purchasing power of social security payments would have fallen dramatically, leading to serious discontent among the pensioners and welfare recipients.
However, if the CPI on average understates inflation by 1.2%, then this might not be very noticeable for bonds investors and also for the people receiving social security payments.
So what can be the concrete examples, where the CPI has understated inflation? Well, in order to illustrate one of those, let us take a look at this daily Crude oil price chart:
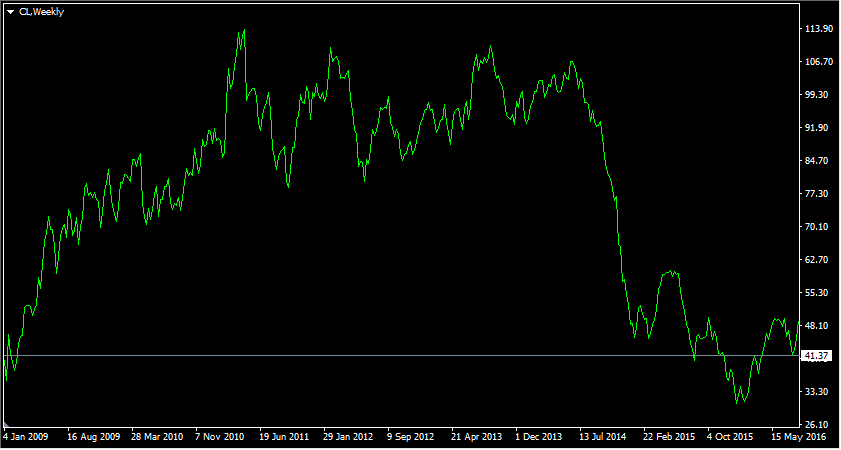
As we can see from the chart above, after the collapse during the 2008 Great Recession, the crude oil price traded near $40 level. During the subsequent months and years, the price of this commodity rose steadily, eventually going all the up to $112 level. This means that in 2 years and 4 months, the oil price has jumped by 180%.
After making such large moves, the price of this commodity started to stabilize and mostly moved sideways during the subsequent period. However, the high oil prices persisted until 2014. It was only during the last quarter of that year when the price of this commodity really started to come down significantly and by 2015 was back to near $40 levels.
Now, here we need to keep in mind that this does not only affect the transportation category but the prices of thousands of goods and services in other sectors as well. The fact of the matter is that stores need transportation to stock their shelves, while restaurants also need transport to gather necessary ingredients. There can be also dozens of other examples, how fuel prices might affect the cost of different goods and services.
In addition to those factors, it is worth noting that from 2009 until 2014 was also the period of large size of quantitative easing programs by the US Federal Reserve, as well as that of several other central banks in the world. It goes without saying that everything else being equal, those QE programs typically tend to devalue the currency and lead to higher rates of inflation. Not to mention the inflationary effects of keeping the key interest rate near 0% levels for years.
Due to all of those considerations mentioned above, one would expect that US inflation during the 2009-2014 period would be considerably higher compared to the historical average.
At this point, one might ask: how does the official and alternative measures of inflation compare with each other during this period? Well, according to the US CPI inflation calculator, during this 5 year period, the general price levels have risen by 10.35%. This means that the average annual rate of inflation during those years was near 2%. This number is actually considerably lower than the long term average CPI rate.
So how do the unofficial measures of inflation compare with the CPI during this period? Well, according to ‘Economist’ back in 2009 the Big Mac Index stood at $3.57. After rising steadily over those 5 years, the index reached $4.79 level by 2014. This means that the amount of increases in percentages stands at 34.2%. Consequently, this suggests that the average annual inflation during this period, according to BMI was at 6%.
Considering the massive increase in the oil prices, as well as the huge size of Federal Reserve’s quantitative easing program, the annual 6% inflation rate, as suggested by BMI, seems a far more believable and realistic figure, then 2%, as posted by CPI. So as we can see from this example when considering how to calculate inflation, investors can benefit from checking out the alternative measures of tracking price changes, other than just focusing on official CPI figures.
Can Some Currencies Benefit from Higher Global Inflation?
When discussing the case of the 2009-2014 period, it is worth noting that some currencies did benefit from rising oil and food prices. It goes without saying that some of the obvious beneficiaries from rising fuel prices were the Canadian dollar (CAD) and the Norwegian Krone (NOK).
However, here it is worth noting that some other commodity currencies also benefited from those developments. In order to illustrate this better let us take a look at this weekly NZD/USD chart:
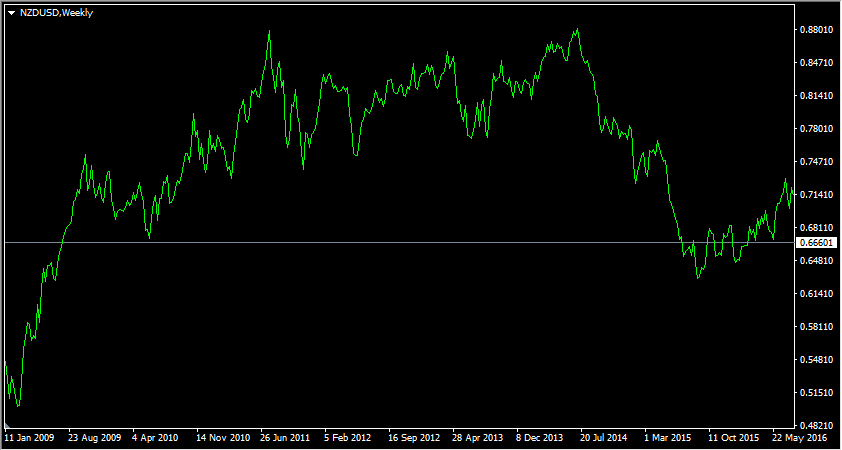
As this diagram demonstrates, by early 2009, the New Zealand dollar has fallen all the way down to $0.50 level against the US dollar. Despite this collapse, the NZD started making some steady gains during the next few years, eventually reaching $0.88 level by June 2014. After making those significant moves, the NZD/USD pair then faced a correction and by the middle of 2016 had stabilized around the $0.70 level.
So what were the main reasons behind the appreciation of the NZD from 2009 until 2014? Well in order to answer this question, it is important to note that New Zealand is one of the largest producers and exporters of dairy products in the world. When the global prices of dairy products rise, many New Zealand producers earn higher revenues and profits. Consequently, the local government also benefits from higher tax revenues as well.
Therefore, the economy of the country is quite well-positioned to benefit from rising global food prices. Consequently, when the dairy price rises, it usually leads to an appreciation of the New Zealand dollar.
Alternative Measurements of Inflation – Key Takeaways
- For several decades the Consumer Price Index (CPI) was one of the most popular and frequently referenced indices for measuring inflation. Despite its popularity, it did become the focus of criticism from financial experts, commentators, and ordinary consumers for understating inflation. The possible reasons for this include the use of such methods as substituting goods and applying so-called ‘hedonic adjustments’ to the prices. This led to many people looking for alternative measures of inflation.
- The possible alternative inflation measurements include such indicators as the GDP deflator. It tracks the price changes of domestically produced goods and services. Some academics and individuals keep track of the prices of products sold by retailers. Finally, we have the Big Mac Index, published by the ‘Economist’ which tracks the average prices of this hamburger in dozens of countries. The cost of producing Big Mac itself does include the prices of at least 16 goods and services.
- The general comparison between the consumer price index and those alternate measures of price level changes does suggest that the CPI might be understating inflation to a certain degree. For example, the average annual CPI over the last 34 years stood at 2.6%, while the Big Mac Index shows the annualized inflation rate of 3.8% during the same period, which is 1.2% higher than those official figures. Therefore, it might be helpful for investors to use alternate inflation measures in their investment decision making process.