Table of content
When it comes to the stock market investing, there are indeed hundreds of different options available for investors to invest in. For many market participants, this can be a difficult choice, since for them it is not clear which ones can provide them with the best rate of return.
What many experienced investors do with investing is to look for those stocks which are considered to be undervalued. The undervalued stock definition is that the current market price of the security, for whatever reason is below its fair value. The logic behind this is that at some point it is likely that the stock price will return to the fair value and consequently, an investor will benefit from the potential capital appreciation.
This part seems quite simple, but there is an obvious question: how to find undervalued stocks? Well, here it is worth mentioning that there are dozens of different methods valuing stocks. However, for the sake of simplicity in this article, we will focus on three some of the most popular and easy to understand techniques the market participants can use.
The most popular method for finding top undervalued stocks is using the so-called price to earnings ratio, also known as the P/E ratio. This indicator divides the current market price on earnings per share indicator, also known as EPS. The basic rule of thumb here is that if the P/E ratio is lower than 15 it is considered to be undervalued, while if it is above 20 then the security is deemed to be overpriced.
Another famous measure for stock valuation is the so-called price/earnings to growth ratio, also known as the PEG ratio. This essentially represents a modified version of the P/E ratio. However, the main difference between those two is the fact that the PEG ratio also takes into account the rate of earnings growth of the company.
Finally, we have a payout ratio indicator. This indicator measures the portion of earnings, which is left over after the company covers all dividend and share buyback expenses. The low payout ratio can be a sign that the company has more room to increase its dividends, as well as the size of the share buybacks.
Benefits of Purchasing Undervalued Stocks
Before moving on to the exact measurements, it is important to address some very logical questions: Why investors are looking for undervalued stocks? What are the benefits of purchasing those securities?
Well, the general theory here is that if investors buy underpriced stocks, then they are more likely to benefit from the capital appreciation. The reason for this is simple: sometimes different stocks simply end up trading below their fair price.

This can happen because the company has performed relatively poorly during one particular quarter and the market has overreacted to the results. Alternatively, there might be an ongoing recession and many investors are simply withdrawing funds from the stock market. Or, the firm in question might be experiencing some major management change. In fact, there can be dozens of other reasons, why the stock price of one particular firm might be trading below its fair value.
Now the past market experience has shown us that if the company has decent management and has grown sales and profitability, those types of undervaluations tend to be just the temporary events. Consequently, sooner or later, the majority of those undervalued stocks eventually end up returning back to their fair value. Therefore, those investors who purchase those stocks at those cheap prices can potentially benefit from the sizable capital appreciation of the security.
There are several additional benefits for this type of investment style, also known as value investing. The fact of the matter is that the regular investors do not have to wait for months for the stock to fall and become undervalued. There are hundreds of different stocks on the market, therefore, the market participants nearly always find some securities which trade below their market value.
Finally, when it comes to those stocks which pay dividends on a consistent basis, if investors manage to purchase them at discounted prices, then their effective yield on investment will be higher than before.
For example, let us suppose that we have stock on the market, which was worth $100. The company pays an annual dividend of $3 per share to its shareholders. This means that the dividend yield of the stock is 3%.
However, let us further suppose that due to some reason, some investors panicked and sold those shares, reducing the price of those securities down to $75. This means that those investors who will purchase this stock at $75, will get an effective yield of 4%, instead of 3%, as before. So, as we can see from this example, finding undervalued stocks is beneficial not only for growth investing but also for income investors as well.
Basics of P/E Ratio
So far we have discussed the potential benefits of investing in undervalued stocks. However, at this point, the obvious question is: how can an investor differentiate between undervalued and overvalued stocks? Well, one of the most popular and simplest measures for finding undervalued stocks is using the price to earnings ratio.
The calculation process of the P/E ratio is quite simple. It divides the current market price of the stock on the earnings per share indicator, also known as EPS. The EPS simply divides the total amount of the company’s earnings on the number of outstanding shares. This means that if the firm has $1 billion in earnings and 500 million in outstanding shares, then the earnings per share indicator will be at $2.00.
The price to earnings ratio, therefore, shows how many dollars one has to pay for each dollar of company profits. In order to understand this better, let us move on to some practical examples. The chart below shows the performance of the Coca-Cola Company (KO) stock for the last 5 years:
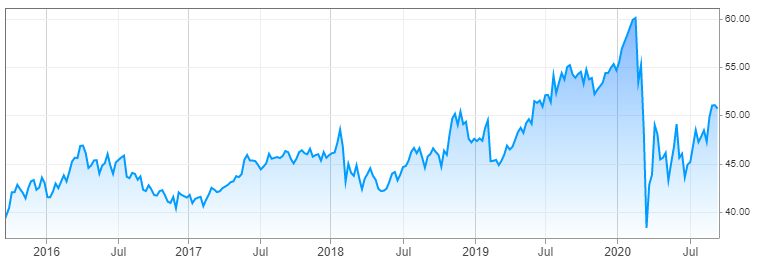
source: cnbc.com
As we can see from the above diagram, 5 years ago the stock was trading near $39 level. During the subsequent years, especially in 2019, the stock has made some impressive gains, eventually reaching a peak at $60 a share by February 2020. The March 2020 stock market crash had a very negative effect on the stock, which fell all the way down to $38, temporarily erasing all of those gains.
However, this decline turned out to be short lived, as the shares began to recover from April 2020. By September 2020, the Coca-Cola company stock (KO) trades near the $51 mark. According to the official data the earnings per share indicator of the firm, currently stands at $2.13. So this means that if we divided the total amount of company earnings on the number of outstanding shares, then we will end up with $2.13.
Now, in order to come up with a price to earnings ratio, we need to divide the current stock price, which is $51 to $2.13, which is 23.94. This suggests that at the moment the Coca-Cola Company shares are slightly overvalued.
As we have discussed before, the stock is generally considered to be fairly valued if its P/E ratio is at or below 20. So this means that this stock has to either return to $42.60 level or its EPS has to rise to $2.55 for Coca-Cola Company stock once more to become fairly valued.
Now, what we have discussed does not represent a case of extreme overvaluation. In order to see such an example, let us take a look at the stock chart of PayPal Holdings (PYPL):
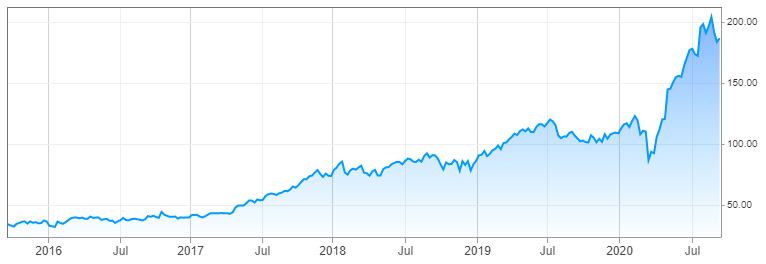
source: cnbc.com
As we can observe from the above diagram 5 years ago the stock was trading close to $33 level. During the following years, the shares have risen steadily, eventually going all the way up to $123 mark by February 2020. At this point, just like with so many other stocks, PayPal shares fell victim to the stock market crash. As a result, the stock fell back to $87 during the middle of March 2020.
However, this correction did not persist for long, from April, the shares began to recover and eventually have returned back to February highs. During the subsequent months, the stock even managed to break above those levels and by September 2020 trades near the $187 mark.
This means that in this 5 year period, the stock price has risen by approximately 5.7 times, which is quite impressive. It goes without saying that the stock has delivered a significant amount of capital appreciation for investors. However, the only downside to this development was the fact that this made the stock considerably overpriced.
According to the latest data, the earnings per share indicator of the company, also known as EPS, currently stands at $2.18. This means that the price to earnings ratio of the firm equals to 187 / 2.18, which is 85.78. This suggests that at current prices, the stock has already reached an extremely overvalued level. In fact, at this point, the shares are more than 4 times more expensive compared to the ‘fairly valued’ territory.
Consequently, this type of stock is not one of the best undervalued stocks to buy now. It can indeed go a bit higher, however, its upside potential at this point is quite limited. On the other hand, it will not be very surprising to see the stock experiencing a major correction, because of its extreme overvaluation. So as we can see here the P/E ratios are a very important factor when trying to identify the most undervalued stocks.
Example of Undervalued Stocks
So far two stocks we have discussed are trading higher compared to their fair value. In the case of Coca-Cola Company stock, it was just slightly overpriced, while PayPal Holdings stock was extremely overvalued. However, at this stage, the obvious question here is: are there any undervalued stocks today? Well, actually there are several stocks which for whatever reason now trade considerably lower than their fair value.
In order to illustrate one example of such a scenario, let us take a look at this chart, which displays the price movements of Bank of America (BAC) for the last 5 years:
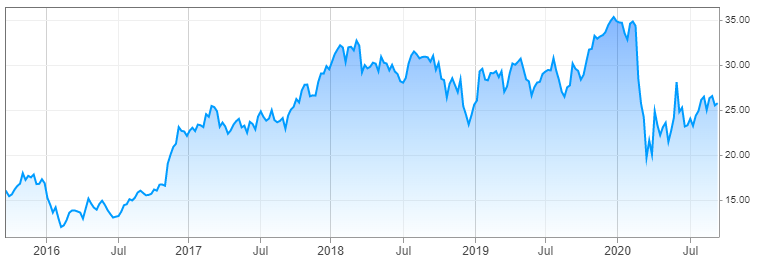
source: cnbc.com
As the above chart demonstrates, by late 2015, the stock was trading near $16 level. The shares mostly moved sideways during 2016, however from Autumn that year, the Bank of America’s shares began their long term upward trend. After making some steady gains during the subsequent years, the stock has reached a peak of $35 by December 2019.
The shares were significantly affected by the March 2020 stock market crash, during which it fell all the way down to $19 mark. However, this major setback was followed by a steady recovery, with the price reaching near $26 level during September 2020. So as we can see here, the stock has regained some of its recent losses, however, it still trades well below 2019 highs.
As the official data suggests, the earnings per share indicator of Bank of America currently stands at $2.08. This means that the price to earnings ratio of the stock is 26 / 2.08, which is the equivalent of 12.50. This suggests that at current prices the stock is significantly undervalued. Therefore, on a P/E basis alone, the Bank of America represents some of the most undervalued stocks 2020 traders might consider buying.
However, at this point, it is important to point out that the P/E ratio is not the only indicator that is used for stock valuations. In fact, there are several other tools, which the market participants can utilize, something we will discuss in greater detail below.
PEG Ratio
As we have seen from the above example, the P/E ratio can be a simple and helpful tool for getting some idea about the relative valuations of stocks. However, one of the criticisms leveled against this indicator is the fact that it is generally a backward looking measure. This argument suggests that the P/E ratio fails to take into account the future earnings of the firm.
In order to address those concerns many experienced investors are using the so-called price/earnings growth ratio, also known as the PEG ratio. The market participants essentially need two components in order to calculate this indicator. The basic formula of the PEG ratio is the P/E ratio / EGR. The EGR in this formula stands for the earnings growth rate for EPS and usually covers a 5 year period.
For example, if the current P/E ratio of the firm is 20 and the expected growth rate of earnings per share at 25%, then the PEG ratio for the stock will be 20 / 25, which is 0.80. Now, the general rule of thumb here is that with currently undervalued stocks the PEG ratio should be lower than 1. At the same time, those securities whose PEG ratio is higher than 1 are considered to be overpriced.
At this point, many people might ask a very logical question: how can investors come up with an expected earnings growth rate over the 5 year period? Well, there are actually two ways to go about it. The first and most popular way to do so is to simply take the cumulative rate of EPS growth over the last 5 years. This is usually the most common method for this type of calculation. In fact, the majority of stock news websites, as well as financial commentators tend to favor this method.
Another advantage of this type of approach is that calculations are not relying on a single year. It is obvious that the company might have some years, where it faced some major headwinds, while during some other periods, it benefited from high growth rates. Therefore, taking the results of 5 consecutive years in many cases tends to balance out those two extremes and give us some idea about the long term direction of the company’s earnings.
The alternative to this approach is to use the analysts’ forecasts for the next 5 years. It goes without saying that predicting future company earnings growth for such an extended period of time is indeed quite a challenging task.
One positive thing about PEG indicators is that investors do not have to find some specifically designed undervalued stock calculator in order to measure it. In fact, many stock news websites and that of financial media outlets offer already calculated PEG ratios for all of the stocks listed on major stock exchanges.
The PEG ratio can be a very handy indicator for compiling a list of undervalued stocks. However, just like with all other undervalued stock indicators it does have some imperfections. The reality of the matter is that the past earnings growth, as well as analysts forecasts simply can not be the 100% reliable indicators for future EPS growth rate.
This became especially apparent after the 2008 Financial Crisis and also in 2020, in the aftermath of the outbreak of the COVID-19 pandemic. In each of those instances, the earnings growth rate for the last 5 years for the majority of companies composing major stock indexes were quite impressive. At the same time, the analysts’ forecasts were also quite positive.
However, in both cases, the financial performance of the majority of those companies has worsened considerably, while the management of those firms was also forced to withdraw their guidance on future earnings. It goes without saying that in those instances many investors have been misled by unrealistic future expectations. Therefore, it is much better for the investors to use the PEG ratio in conjunction with other indicators for stock valuations.
Payout Ratio
At this point, it is important to mention that the underpriced stocks which offer some bargains to investors are not strictly limited to one or several industries. There are no undervalued stock sectors, which can always guarantee investors value investing. However, what rightly concerns many market participants is the company’s continuing ability to return money to shareholders.
The fact of the matter is that one can always find stocks with very low P/E and PEG ratios, however, the undervalued stock meaning does not include a guarantee that the firm in question will always be able to maintain its dividends and stock repurchases. In order to achieve this, the firm must be in a good financial position to make those benefits to shareholders sustainable.
One indicator which income investors and other types of market participants use as an undervalued stock screener is the so-called payout ratio. This indicator is usually expressed as a percentage. It shows what portion of the earnings the individual company spends on dividends and share buybacks. So for example, if the firm’s annual earnings are at $300 million and it spends $240 million for the benefit of shareholders, then the payout ratio of the stock will be 240 / 300, which is 80%.
Now the general rule of thumb here is that if the P/E ratio is at 50% or below, then the firm is considered to be in a good financial position to continue returning money to shareholders. At the same time, if this indicator is within 50% to 80% range, then this is not considered ideal, but many investors still believe that those payouts are safe at least in the foreseeable future.
However, on the other hand, if the payout ratio is above 80%, then this might be a major sign that the firm’s payouts to shareholders are unsustainable. If for whatever reason the company revenues drop, or if expenses rise considerably or the management faces any other headwinds, then the organization might have a very difficult time to sustain those payments. Many investors and financial experts believe that in those situations, the firm will be likely to cut dividends or reduce the total amount of stock buybacks.
Actually, in some extreme cases, there are firms which have their payout ratios at 100% or higher. This means that the company spends all or more than its profits on those items mentioned above. Obviously the firm might be able to sustain those payouts with its cash reserves or by borrowing for one or two years. However, it goes without saying that this is an unsustainable policy.
Therefore, the undervalued stock is more likely to achieve a decent growth in the future if it’s payout ratio is relatively low. This gives the management an ability to increase dividends to shareholders, as well as stock repurchases. It is not surprising that everything else being equal those two measures, typically tends to have a positive effect on the share price.
Undervalued Stock Finder – Key Takeaways
- At any given time there are some number of stocks at the market which trade below the fair value. Those securities are also called the ‘undervalued stocks’. Many investors are actively looking for undervalued stocks since they believe that those that offer some value to market participants are more likely to rise in the future.
- The price to earnings ratio, also known as the P/E ratio is one of the most popular indicators for stock valuations. It is calculated by dividing the current market price of the stock on the earnings per share indicator. The general rule of thumb here is that if the P/E ratio is lower than 15, then it is considered to be undervalued, while if it is above 20, then it is deemed to be overpriced.
- Besides the P/E ratio, some market participants also make use of the price/earnings growth ratio. This indicator divides the current P/E ratio on the last or forecasted 5 year earnings growth figures. In addition to that, some investors also take a look at the payout ratio. This measures the percentage of earnings spent on dividends and stock repurchases.