Table of content
The consumer price index measures the annual price change of the basket of goods and services in a given country. It is one of the most important and popular measures of inflation.
Here it is worth mentioning that there is no one universally accepted method of measuring CPI. Each country and its respective statistical agency has its methodology of composing the basket of goods and services. However, despite those differences, CPI is used as the benchmark for measuring price changes in the country.
The regular monitoring of the latest developments in the Forex CPI indicator can be very helpful for traders. Firstly, it is very important to remember that nearly all central banks in the world have some sort of target for inflation. This means that if the CPI rate diverges significantly from its intended goal, policymakers do often respond by changes in the key interest rates and sometimes even resort to such measures as quantitative easing and other methods.
It goes without saying that those types of changes in the monetary policy can have a major impact on the exchange rate movements. Consequently, it would be logical to conclude that very often changes in CPI rates can give us some valuable clues about the future possible path of the monetary policy of a given central bank, as well as that of the Forex market.
Here it is helpful to point out that there is also another way how cpi affects Forex. In the long term, the inflation differentials between two different currencies can have a significant impact on the exchange rates. The fact of the matter is that when the inflation rate in one country is consistently higher than in the other nation, then the average price of goods and services in the former becomes much more expensive in relation to the latter.
It is clear that this process makes the country’s products less competitive, eventually leading to a decline in the demand for the currency and its depreciation. On the other hand, currencies with persistently low inflation rates in the long term tend to appreciate against their peers. Therefore, we can conclude that having knowledge of the latest inflation dynamics can be helpful for not only the short term trades but also for long term trading as well.
Consumer Price Index Formula
As mentioned above, every country has its methodology for composing and measuring changes in the consumer basket of goods and services. Therefore, in order to make it easier to understand how statisticians are calculating CPI, let us take an example from the US Bureau of Labor and Statistics:
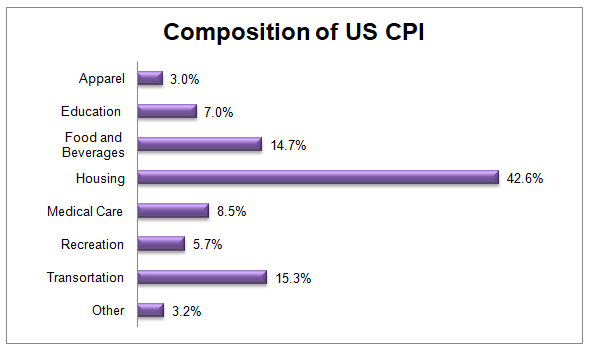
As we can see from the above chart, the CPI is composed of several components. The largest of those is represented by housing, which makes up 42.6% of the index. The likely reason behind this is the fact that Americans spend a considerable portion of their income on such housing expenses as mortgage and rent. Consequently, any changes in the average prices of those items can have a significant impact on a budget of US households.
The second most significant component of the consumer price index is the ‘Transportation’ category, making up 15.3% of the indicator. This category includes such items as the price of fuel, cars, as well as ticket prices of public transportation. This is one of the reasons why the increases in the price of oil can have a very significant impact on CPI.
The third largest component of the CPI is represented by the ‘Food and Beverages’ category. This is not surprising since food is the most important item of human survival. Since consumers purchase those types of products on a daily basis, even small changes in the prices of those items can be very noticeable for the public.
This is followed by the ‘Medical Care’ category, making up 8.5% of the index. Here it is worth mentioning that in the US and any other countries, the medicare prices have the highest average inflation rates, compared to other categories. It goes without saying that this creates some serious long term problems which had to be addressed sooner or later.
The next largest item in the CPI calculation process is Education, making up 7% of the index. This is followed by Recreation (5.3%) and Apparel (3.0%) components. Those items, which do not belong to any of the components we discussed above, are put into the ‘Others’ category, which makes up 3.2% of the index.
Each category is further divided into subcategories. For example, the ‘Foods and Beverages’ component includes such products as bread, meat, cheese, fruits, vegetables, eggs, and other items.
Here it is important to mention that over the years the exact methodology of computing the consumer price index might change considerably. The fact of the matter is that over time the consumer spending habits might change significantly. Therefore, in order to take account of those factors, the statistical agencies do not leave the basket of goods and services fixed for several years. Instead, those government officials make regular modifications in accordance with the changes in consumer spending habits.
The statistical agencies usually update CPI on a monthly basis and make this information available to the public. For example, after calculating the consumer price index, the US Bureau of Labor and Statistics publishes the latest reports on their website. Here consumers can also use an inflation calculator, where they can compare the changes in price levels over the long periods of time.
Alternative Measures of CPI
Another important thing to know about those inflation measures is the fact there are several types of CPI. One of the most famous alternatives to traditional CPI is core CPI. The main difference between those two measures is that the latter ones exclude the food and fuel costs from calculations.
The rationale behind this change is that due to the volatility of commodity prices, those two categories are more volatile than other components. Therefore, by taking those items out of the equation, one can filter out the extreme volatility and see the core dynamics of inflation.

The obvious criticism of this approach is that food and transportation are two vital categories for consumers. Therefore, if one excludes those items, then this can significantly alter the measure and make it inaccurate.
Here it is helpful to note that the world’s major central banks take different approaches to this question. The US Federal Reserve made it clear on many occasions that it gives a preference to the core inflation measures. The line of reasoning behind this is as follows: by targeting core inflation, the policymakers do not have to respond to temporary effects of commodity price fluctuations.
On the other hand, the European Central Bank targets the headline inflation rate. This means that even if the rise of commodity prices is responsible for the inflation rate going well above the intended target, then the European policymakers are likely to respond to those developments by hiking interest rates.
Those principal differences became quite apparent back in 2011. At that time the price of oil has risen steadily, leading to a notable rise in the cost of fuel and transportation. Those items composed a considerable portion of the Eurozone Harmonized Index of Consumer Prices (HICP), the EU equivalent of CPI. As a result of this development, the HICP has risen steadily, eventually reaching 3% by the Summer of 2011.
In the United States, the inflationary dynamics were very similar. Here the headline CPI has also surpassed the 3% mark. On the other hand, the core CPI was much lower, because this measure excludes food and transportation items.
Here it is important to note that the European Central Bank has a single mandate of achieving the price stability. They define this term as keeping the inflation rate below, but close to 2%. It goes without saying that, at that time the HICP was much higher than the intended target. Therefore, the ECB has responded to this challenge by two rate hikes, lifting up its key interest rate from 1% to 1.5%.
The result of this policy was that the inflation rate quickly fell back to the intended target. However, at that time the Eurozone was in the midst of the sovereign debt crisis. Therefore, due to the subsequent weakness of the economy, the inflation rate then fell below its intended target. The failure to return the HICP levels to their desired aims is one of the reasons why eventually the ECB decided to cut rates to 0%.
In sharp contrast to this response, the US Federal Reserve decided to keep its own interest rates unchanged. As a result, the CPI stayed above its intended target for a longer period of time, until falling back closer to 2%. The US policymakers did eventually start to normalize the policy and authorize the first rate hike in a decade in December 2015.
How CPI Affects Forex Exchange Rates?
As we have discussed before, the CPI rates can play a very important role in the decision-making process of the central bank. Consequently, exchange rates tend to respond to the latest inflation dynamics of currencies. To illustrate this point better, let us return back to our 2011 example. On this daily EUR/USD chart, we can see how the pair has performed before and after the ECB rate hike:
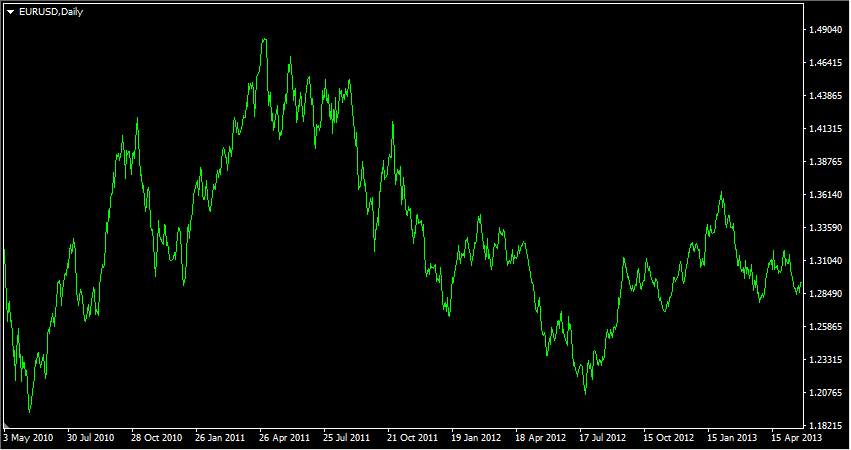
As we can see from the above diagram, the Euro has suffered significant losses during May 2010, dropping from $1.30 all the way down to $1.18 level. After this development, the single currency began to recover. At that time the Eurozone HICP measure has increased steadily and is going above the 2% level and eventually even going as high as 3%.
Here it is important to take note of the fact that the first ECB rate hike did not come until April 2011. However, as we can see from the chart, the Euro has already reached $1.40 level in March 2011, a month before the European policymakers made any decision on the interest rates.
The high-point of the EUR/USD exchange rate during 2011 came in early May when the single currency has reached $1.48 level. One of the reasons for this was the fact that at that point the Eurozone HICP has already reached 3%. Consequently, traders and investors were anticipating another rate hike.
Their predictions were proven to be right. The European Central Bank did authorize another rate hike in July 2011, taking rates up to 1.5%. As we can see this did not have much of an impact on the exchange rates, which moved sideways and remained relatively flat until the end of August 2011.
From September 2011, the Euro exchange rate began to drop sharply. One of the catalysts of this move was the fact that the Eurozone HICP began to drop considerably. Therefore, traders and investors did not wait for the ECB’s confirmation of their predictions and simply started selling the single currency. By early October 2011, the exchange rate was already down to $1.32 level.
Responding to the sharply declining Eurozone inflation, the policymakers at the European Central Bank have authorized two rate cuts during the last 2 months of 2011, followed by another reduction in June 2012.
This led to a further decline in the Euro exchange rate, with the single currency falling all the way down to $1.20 level by July 2012. After this decline, the Euro recovered and stabilized around $1.30 level.
Main Principles of CPI Forex trading
So at this stage, the obvious question here is: What is the essence of the CPI effect on Forex? How can we interpret the market movements in the above example? Well, here it is important to mention that there is no such thing as the Forex CPI formula, which could tell us the exact impact inflation rates have on the Foreign exchange market. However, by observing the above example, we can come up with the following conclusions:
- In the short term, when the consumer price index of a given currency goes above the intended target of its central bank, it can be a major bullish sign. The reasoning behind this is the fact that traders and investors assume that this process can eventually lead to the rate hike. This in turn will make the currency in question more attractive, since market participants can now earn higher returns from carry trades, savings accounts, and certificates of deposit. Consequently, the currency appreciates.
- Most central bank interest rate decisions are already priced in, well before its actual announcement. Traders and investors always assume that the policymakers will respond in a predictable manner to the latest changes in inflation. Therefore, the direction of the CPI trends can tell us a lot about the future possible path of the exchange rates.
- When it comes to major banks, they always try to adjust interest rates gradually, especially in times of rate hike cycles. So for example, if policymakers want to raise rates by 100 basis points, most likely they will do this incrementally with four 25 basis point rate increases, rather than going for one large raise. One can look at this as some sort of an insurance policy. It supports the stability in the stock and Forex markets. Also, this makes it easier for central banks to reverse the policy if the circumstances change.
Therefore understanding those points is essential for getting familiar with CPI Forex basics. Without those types of analyses, the market movements in response to inflation rate publications and central bank decisions make very little sense.
CPI Forex Guide to Long Term Trading
For some number of traders, it might be surprising to know that making short term exchange rate predictions is not necessarily the only way how CPI is used. In fact, this measure can have an important long term application as well. Obviously, there is no official CPI Forex definition which states that, however, we do have a Purchasing Power Parity (PPP) theory.
The PPP essentially represents the level at which the average prices of goods and services will be equalized between the two given countries. According to the PPP theory, in the long term, the exchange rates tend to converge around the Purchasing Power Parity levels.
This is because if in one country the average price of products is lower than in other nations, they tend to be more attractive for importers. As a result, the demand for those goods and services rises. However, in order to access those goods and services, foreigners convert their capital into the local currency. Consequently, this creates a natural demand for the currency and eventually leads to its long term appreciation.
So what this has to do with CPI Forex meaning? Well, when a given country has a higher inflation rate compared to its peers, over the years the average price of its goods and services becomes much higher than in other nations. This process makes the products of the given country much less competitive, leading to the depreciation of the currency.
In order to illustrate those dynamics better, let us take a look at this daily USD/TRY chart:
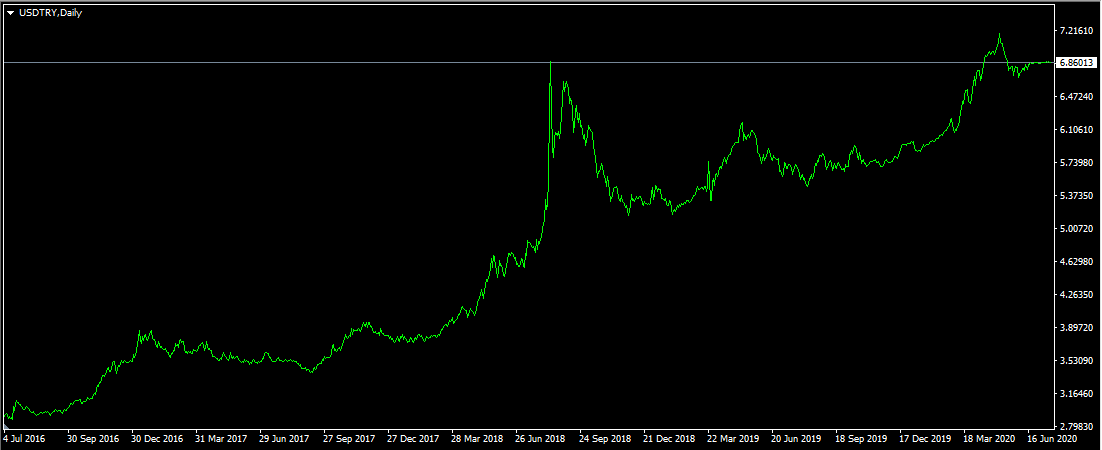
As we can see from the above image, 4 years ago, the pair was trading at 2.90 level. From September 2016, the Turkish lira began its steady depreciation, already surpassing 3.50 mark before the end of the year. During the subsequent years, the USD/TRY kept rising, eventually reaching an all-time high of 6.85 mark, by August 2018.
This was followed by a sharp correction, where the Turkish lira managed to regain some of its losses, dropping all the way down to 5.15 level by January 2019. Yet, this setback turned out to be quite temporary. During the following months, the USD resumed its uptrend and by July 2020, still traders above 6.85 level.
This means that in 4 years, the USD/TRY has risen by a massive 136%. As we can observe from our chart, the process of lira depreciation was gradual. This was not a result of just one particular event.
Actually, one logical explanation here is the existence of persistent inflation differentials between those two currencies. The long term average inflation in the US stands at 3%. In fact, during the last two decades, the US CPI average was much closer to 2%. In sharp contrast to this state of affairs, from 2000 until July 2020, the average inflation rate in Turkey is 13.6%.
This means that on average, the annual inflation differential between the US dollar and the Turkish lira is higher than 10%. Then it is not surprising that over the years the PPP indicator has shifted in favor of USD. For example, adjusting for currency redenomination in Turkey, according to the British financial journal ‘Economist’ the PPP level for USD/TRY back in 2002 stood at 1.61. As of 2020, this indicator has already reached 2.45 level. If we take the GDP per capita differentials into account, then the PPP level for USD/TRY will reach 3.82.
It is true that today’s exchange rates are even higher than those levels. However, this just proves the fact that investors just assume that Turkey will experience much higher inflation rates than the US for years to come.
Therefore, traders should keep in mind that when there is a significant inflation differential between two currencies, over the long term this gives a considerable advantage to the currency, which has lower CPI rates.
Criticism and Alternative Measures of CPI
It is important to mention that despite all of its benefits and uses, CPI does have its critics as well. Some financial experts, like Peter Schiff, the Chief Executive Officer of Euro Pacific Capital, argue that the CPI understates the real inflation rate.
One of the things in measuring CPI, which came into increasing criticism over the years, is the method of so-called ‘hedonic adjustments’. This might sound as a very complicated term. However, the main premise behind this is rather simple. According to the Bureau of Labor and Statistics, hedonic adjustments remove any price differentials which resulted from an improvement of quality.

This mostly applies to clothing and technology products, like mobile phones and computers. This means that if for example, the price of new types of shirts, or cell phones rises by 1%, BLS might only add 0.5% increase CPI, subtracting the rest 0.5% for quality adjustments. This obviously attracts criticism from some cycles of economists, since quantifying quality is a very subjective matter and one can easily get it wrong.
Another controversial question is the use of substitution method in CPI calculations. According to this method, if from two products from the same category, the price of one of them rises faster than the other, then the statistics agency will give greater weight to the cheaper item in its calculations.
To make it easy to understand, let us take a practical example. Let us suppose that one store has two sets of milk products and call them A and B type milk respectively. Let us further suppose A type milk costs $3.00 and the price of B type milk stands at $3.50. Finally, let us assume that both of those products have the same 50% weight in the ‘Milk’ category of CPI.
After one year, the price of A has risen by 2% and reached $3.06. At the same time, the cost of B type Milk has increased by 6% and became $3.71. Now, if the statistical agency used the fixed goods and services in its methodology and did not use substitution adjustments, then the calculation is very simple. The average number between 2% and 6% is 4%. Therefore we can conclude that the inflation rate with the milk products was 4%.
However, by using substitution adjustments, the statisticians can assume that more consumers will switch to buying A type milk, because its price has risen by a smaller amount. By giving 75% weight to A type milk product and 25% weight to B type, the inflation rate will be 3%, 1% lower compared to the previous case.
So as we can see there can be several scenarios where the official CPI figures might understate the inflation rate. This is why some financial experts and economists are using the alternative measures of inflation in their analysis. This includes the ‘billion prices project’ which tracks online prices for more than a thousand retailers.
Some experts, like Peter Schiff, also make use of the Big Mac Index, published by the British financial outlet the ‘Economist’. It tracks the average price of the Big Mac in different countries. This represents some sort of simplified version of the consumer goods basket. This indicator includes the price of bread, cheese, lettuce, cucumber, onion, sesame seeds, as well as the cost of labor, electricity, transportation, rent, and taxes.
CPI Forex Definition – Key Takeaways
- The consumer price index (CPI) measures the rate of annual changes in the basket of goods and services in a given economy. The CPI consists of several components, like food, transportation, apparel, health care, education recreations, and other spending categories. There is no standard universally accepted formula for calculating CPI. Every country and its statistical agency have their unique methodology for measuring the annual rate of inflation in the country.
- The latest releases of the consumer price index reports can have a significant impact on the short and medium term currency exchange movements. The reason for this is the fact that nearly every central bank in the world has some sort of target for the inflation rate. Therefore, when the CPI deviates from those goals significantly, investors and traders assume that the central bank will respond by increasing or cutting the interest rates, depending on the circumstances. Therefore, in many cases, the release of the latest CPI numbers is followed by a higher degree of volatility.
- Researching CPI numbers can be also helpful with the long term analysis as well. The fact of the matter is that according to the Purchasing Power Parity theory, the differentials in the inflation rates between two currencies can have a significant impact on the long term exchange rates. Therefore, currencies with lower inflation rates tend to appreciate against their peers which have higher CPI rates. This tendency is especially apparent when it comes to the exotic currency pairs.