Table of content
The trade balance is one of the most important announcements in Forex trading. It is usually listed as ‘high expected volatility’ in the economic calendars of several brokerage companies and Forex news websites.
Despite its perceived complexity, the balance of trade definition is quite simple. This indicator measures the difference between the total value of exports and imports in a given country.
This means that if the total number of exports exceeds the total value of imports, then the country has a positive trade balance, something which the economists also call the trade surplus. This can be very beneficial to the economy. Since the net exports are one of the components of the Gross Domestic Product (GDP). Therefore, the trade surplus does promote a higher rate of economic growth.
The opposite is also true. If the total value of imports is higher than the exports, then the country will have a negative trade balance. This is also known as the trade deficit. The negative trade balance tends to reduce the GDP. Consequently, running a high level of trade deficit can certainly reduce the rate of economic growth considerably.
This means that running a trade surplus can be beneficial for the currency of the given country. The reasoning behind this is not only the fact that it promotes higher GDP growth. Here we need to also keep in mind that when the goods and services of a particular country are in high demand, this also extends to its currency as well.
As a result, we have several currencies which have very low interest rates and theoretically should not be attractive to investors and traders. However, the fact that they maintained the trade surplus for years, did allow those currencies to maintain their strength and appeal.
Understanding the Balance of Trade
As we have discussed before, the formula for calculating the BOT is very simple. The trader only needs to subtract the total value of imports of a given country from the total value of exports. If the resulting number is positive, then we are dealing with the trade surplus. On the other hand, if the result is represented by the negative number, then this is the case of the trade deficit.
In theory, there can be even the third scenario of a country having a perfectly balanced trade. This would be the case if the total value of exports is equal to that of imports. However, due to the fact that we are dealing with billions of dollars here, such occurrences are very rare indeed.

So at this stage, one might be wondering why does the unfavorable balance of trade have a negative effect on the rate of economic growth. Well, in order to respond to this question, let us remember the GDP formula.
Essentially the Gross Domestic Product represents the sum of 4 major components. The formula is expressed as Y = C + I + G + NX. Here Y stands for GDP, the C denotes household consumption. This includes the total amount of consumer spending on food, clothing, recreation, healthcare, education, and all other categories. In the case of the heavy majority of countries, this represents the largest component of GDP. In fact, in the US, the Consumption component makes up at least 2/3 of GDP.
The second component of the Gross Domestic Product formula expressed as I stand for business investment. This covers the total amounts of firms spend on machinery, equipment, technology, and other types of capital expenditure.
The third category expressed as G in the formula represents government spending. This is the only component that is directly controlled by the government. Because of this, in times of recession, governments try to increase their spending. The reason behind this is that in this way, the policymakers are trying to offset at least some of the losses to the economy, due to reduced levels of household consumption and business investment.
As we can see all components we have discussed before can only be represented by the positive number. After all, consumers, businesses, and governments always spend at least some amount of money, regardless of the economic circumstances. However, in the case of the fourth component, it is different.
The NX number in the formula actually stands for the net exports. This means that the negative trade balance tends to reduce the size of GDP, composed of those 3 components we discussed before. On the other hand, the amount of the trade surplus is added to the GDP, just like in the case of other components.
Here it is worth noting that, in Forex analysis, it is not only the existence of the trade deficit that matters but also its size. If a given country has a very small amount of negative trade balance, then it might have a very little negative impact on its economy and on its currency. At the same time, if the size of the trade deficit is large, then in the long term it can significantly reduce the rate of economic growth.
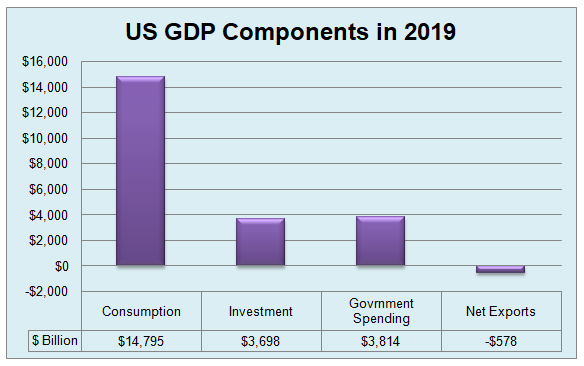
To illustrate this, let us take a look at the composition of the US GDP in 2019:

As we can see from the above diagram, the US had run a $578 billion trade deficit during the year. The total household consumption, business investment, and government spending in the US stood at $22,307 billion. However, the US GDP stands at $21,729 billion, because of the fact that the $578 billion was subtracted from the country’s Gross Domestic Product. This means that the trade deficit has reduced the size of the US GDP by approximately 2.6%.
It is also worth noting that in order to find out the size of trade balance Forex traders do not need to make any calculations themselves. All they need to do is to take a look at the Forex calendar. As the official statistical agencies post the trade balance figure, it is also updated on Forex calendars as well.
How does Trade Balance Affect Forex Market?
At this stage, it is worth noting that if we analyze several long term charts, it becomes obvious that in many cases the favorable trade balance can certainly benefit currencies and support its strength.
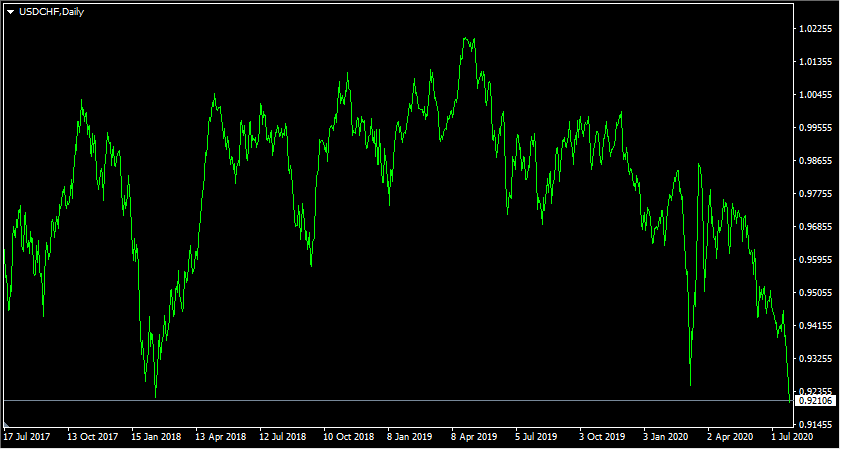
In order to illustrate this let us take a look at this daily USD/CHF chart which covers the price action fo the pair for the last 3 years:

As we can see from the above diagram, the pair was trading at $0.96. After some initial appreciation, the US dollar suffered some significant losses and by February 2018 has dropped all the way down to 0.92 level. However, due to the repeated rate hikes by the US Federal Reserve, the American currency recovered and began a new upward trend. As a result of this development, by May 2019, the USD has overcome the parity level and reached 1.02 mark.
Despite this show of strength, as the US Federal Reserve reversed its monetary policy and started cutting the rates, the US dollar began its slide. This downtrend persisted for more than a year so far, with the USD/CHF pair now already down to $0.92 level.
This means that despite a significant degree of fluctuation, during this 3 year period the US dollar fell by approximately 4.2% against the Swiss franc. Now, this might not be a very dramatic move, but it can be highly surprising for many traders.
The fact of the matter is that the monetary policy differences between those 2 central banks which manage those currencies are considerable. Back in 2015, the Swiss National Bank authorized yet another rate cut, reducing its key interest rate to -0.75%. Since then the SNB kept the policy unchanged. Instead of considering the possibility of normalization and at least raising rates to 0%, the SNB stated that further rate cuts were at the table.
For the heavy majority of the world’s central banks, the 0% is a de-facto lower bound for monetary policy. However, in sharp contrast to this approach, the Swiss National Bank has already moved deep into the negative interest rate category and is even now considering to move interest rates to -1.00% or even lower.
As a result, the majority of clients in Swiss banks are already charged with 0.75% interest for holding balances above 250,000 CHF. This obviously creates a strong incentive for wealthy investors to convert their holdings from Swiss francs into other currencies, where they will not have to pay interest for depositing and keeping their savings on bank accounts.
It goes without saying that the Swiss bank customers always have an option to withdraw their money and keep in in cash to avoid those fees. This might work fine with smaller amounts, however keeping hundreds of thousands of francs even at safe, can be a highly risky option. So as we can see the decisions of the Swiss National Bank did create a lot of problems for Swiss savers.
On the other hand, the US Federal Reserve did start raising interest rates from December 2015. By the end of 2018, the US Federal Funds rates had risen up to 2.5%. Due to the economic downturn, caused by the outbreak of the COVID-19 pandemic, the US policymakers did reduce rates back to 0% to 0.25% range. However, even those low rates are much better than -0.75%.
As we can see from this analysis the interest rate differentials clearly favored the US dollar. Depending on the time period, the nominal interest rates in the US were from 1% to 3.25% higher than in Switzerland. Consequently, one could expect that over those 3 years, the US dollar should have made some significant gains against the Swiss franc. However, as we already know from our example, this is not the case. Instead of making any overall gains, the US dollar lost more than 4% against the CHF.
So how can one explain the reasons behind this dynamic? Actually, this is exactly where the Forex market trade balance comes into play. The fact of the matter is that as the US reported a trade deficit of $578 billion, Switzerland posted a $36.8 billion trade surplus, which represents 5.21% of the country’s Gross Domestic Product. So as we can see here this difference can give a significant advantage to the Swiss franc.
The fact that Switzerland runs such a significant trade surplus, suggests that there Swiss goods and services are in high demand. In order to purchase and import those products, foreign individuals and companies have to convert their local currency to the Swiss franc. This creates an additional demand for CHF and supports its strength.
So what we are dealing with here is the fact that the massive Swiss trade surplus, essentially neutralized the negative effects of negative interest rates for CHF.
This is why, understanding balanced trade mechanics, many governments try to give incentives to businesses and individuals to export more products and reduce the number of imported goods and services. Considering the fact that those are the only 2 components of the balance of trade, those measures, in general, can promote the higher rate of the economic growth of the country.
Dynamics of Trade Balance
It goes without saying that the trade balance is not a static indicator, instead it is updated on a monthly basis. Therefore, the latest changes in trade balance compared to the previous year can also have a significant impact on the currency exchange rates.
Returning to our previous example, during 2000 and 2001 Switzerland had a trade deficit of approximately $2 billion, which at that time represented 0.7% of the country’s GDP. During that time, in sharp contrast to today’s exchange rates, the USD/CHF mostly traded within 1.70 to 1.80.

However, from 2002 the trade balance picture of Switzerland began to improve. During that year, the country has reported a trade surplus worth $4.5 billion, which was 1.35% of GDP. During the subsequent years, the trade surplus has risen gradually, eventually exceeding the $36 billion mark and representing more than 5% of GDP. Actually, it was in 2002 when the Swiss currency began its long term uptrend against the US dollar.
So as we can see from the example, it is not only the existence of the trade surplus but also the improvement in trade balance which can have a positive effect on the exchange rate of the given currency.
Exceptions to General Rule
At this stage, for the sake of accuracy, it is very important to point out that running a trade surplus does not always guarantee to have a strong currency. It is true that everything else being equal, having a positive trade balance is beneficial to one’s currency. However, here it is worth remembering that when it comes to the exchange rates there are several factors other than trade balance that affect the currency pairs.
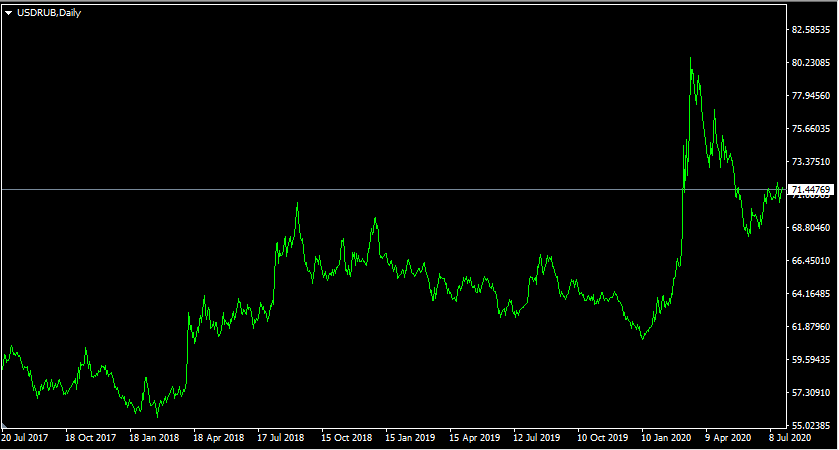
Consequently, we can have some currencies with a sizable trade surplus, but at the same time, they still show weakness in the Forex market. On the other hand, there are also currencies with significant trade deficits, but they perform quite well against their peers. To illustrate one example of this, let us take a look at this daily USD/RUB chart:

As we can see from this image, 3 years ago, the pair was trading at 59 level. During the subsequent months, the Russian ruble gained some strength and by the end of February 2018, the USD/RUB pair dropped all the way down to 55 level. However, during the following months, the US dollar made some notable gains, erased all of the recent losses, and by September 2018 has already reached the 70 mark.
At this stage, the sharp appreciation of the US dollar has stopped. The pair started to move sideways. In fact, from 2019 the Ruble started to erase some of its losses. By the end of the year, the pair was back in 61. However, the outbreak of the COVID-19 changes the entire dynamic. The US dollar appreciated sharply and at one point even pierced 80 level in March 2020. During the subsequent period, the exchange rate moderated, and by the end of July, the USD/RUB exchange rate trades close to the 71 level.
This means that during this 3 year period, the USD/RUB exchange rate has risen by 20.3%, which represents quite a significant degree of appreciation. At this stage we have already discussed in detail what is the balance of trade and how does it affect the exchange rates. So the sharp appreciation of the US dollar against the Russian ruble might be surprising in light of trade balance figures.
In 2019, Russia recorded a trade surplus, worth $164.7 billion. This number represents 9.69% of the country’s GDP, which is considerably higher than in the case of Switzerland. So if this was the only factor that influenced the exchange rates, then most likely the Russian ruble would have appreciated against the US dollar considerably. However, the truth of the matter is that there were several factors, which led to the rise in the USD/RUB exchange rate. Here are some of those reasons:
The average inflation rates in Russia are much higher than in the US. The long term average inflation rate in the United States stands at 3%. On the other hand, during the last 18 years, the Russian consumer price index (CPI) fluctuated between 2.8% to 15.8%. If we take the midpoint from those figures, then we can conclude that the average inflation rate should be close to 9%. This means that the average CPI in Russia is approximately 3 times higher than in the United States.
As the Purchasing Power Parity theory suggests, in the long term, currencies with lower inflation rates tend to appreciate against the ones with higher CPI rates. The Purchasing Power Parity indicator itself measures the exchange rate at which the average prices for the goods and services will be equalized between the two given countries.
In fact, the data provided by the British financial magazine the ‘Economist’, the PPP level of USD/RUB currency pair has risen by 50% in favor of the US dollar. As long as this inflation rate differentials persist, this can lead to further appreciation of the US dollar against the Russian ruble.
This was not the only factor at play, which led to the depreciation of the ruble. Another important dynamic that led to this process is the fact that the Bank of Russia has reduced its key interest rates considerably. The Russian policymakers have reduced their key interest rate from 10% back in 2017 to 4.25% by the end of July 2020. It goes without saying that such a large reduction has significantly reduced the attractiveness of the Russian ruble for investors and trades.
The list of additional reasons include lower oil prices. Here it is worth noting that approximately half of Russia’s budget revenues come from the energy sector. Therefore, the fall in the oil price can have a very negative impact not only on the profitability of Russian energy companies but also on Russia’s public finances as well.
So as we can see from this example, the positive impact of the trade surplus on the currency can be more than offset by other factors, such as interest rates, commodity prices, and PPP dynamics. Obviously the same goes for the opposite case. The currency can have an unfavorable trade balance but still rise against most of its rivals, due to interest rate appeal or by a number of other reasons.
Consequently, in order to make their analysis as accurate as possible, traders should treat trade balance as just one of the considerations and should not base their trading decisions solely on this indicator. Instead, traders should take several fundamental indicators into the account, before deciding to open any positions. This can help traders to protect themselves from some of the most common mistakes associated with the fundamental analysis.
Trade Deficit and Value of USD
Here it is also worth noting that the fact that the US has a large trade deficit, it does not necessarily mean that this guarantees the long term depreciation of the US dollar. In fact, we can observe that despite rising trade deficits the US dollar performed quite decently against most of the other major currencies during the last decade.
So why does the USD lose ground against other currencies, as a result of the large trade deficit? Well, here we need to remember that the US dollar is the world’s reserve currency. There are millions of people who purchase USD not to purchase the American goods or services but to store some of their wealth in a stable currency.
After all, there are many countries in the world with high inflation rates, therefore it makes a lot of sense for savers and investors in those nations to convert their savings to USD. The long term historical average suggests that they can retain 97% of the value of their savings, even if they do not earn any return on them. Obviously, those investors can also purchase US treasuries or buy real estate and earn some returns as well. This creates a high demand for the US dollar and helps it to maintain its value over extended periods of time.
Understanding Trade Balance – Key Takeaways
- The trade balance indicator is one of the most important items on the Forex calendar and very often is a market with ‘high expected volatility’. This measures the balance between the total value of exports and imports of a given economy. It can be expressed both as an actual dollar amount or the percentage of the Gross Domestic Product. The net exports are also one of the four components of the GDP. Consequently, the trade balance can have a significant impact on the rate of the economic growth of the country.
- The positive trade balance can be beneficial for the currency for at least two main reasons. Firstly, the trade surplus increases the rate of economic growth. Secondly, the high demand for the goods and services of the country also extends to its currency. This is because the foreign businesses and individuals have to convert their capital into the local currency in order to be able to purchase those products. This creates a natural demand for the currency and helps its long term appreciation.
- Despite all the benefits of running the trade surplus, it is important to keep in mind that this does not necessarily guarantee the strength of the currency. When it comes to the exchange rate dynamics, there are many factors that influence those movements. Interest rate differentials, commodity prices, purchasing power parity levels, economic growth rates, and many other factors all can have a significant impact on the Forex market. Therefore, traders should take several factors into account when making trading decisions.


