Table of content
While reading the works of financial commentators and Forex analysts, we often hear the term ‘correlated currencies’. Consequently, many people wonder what is the meaning of this expression and how successful traders are using correlated currencies for their own advantage.
This might sound rather a complicated term. However, the premise behind this is very simple. Positively correlated currency pairs are the ones that typically tend to move in the same direction. Obviously, this does not imply that those two securities will always experience the same amount of gains or losses. Yet, in many cases, they do tend to maintain a high degree of correlation for extended periods of time.
There are also cases of the negative correlation between currency pairs. Those pairs, unlike in the previous case, tend to move in opposite directions.
Traders can use currency correlation in Forex trading in several ways. Firstly, market participants can significantly reduce their risk exposure, by avoiding trading two highly correlated currencies simultaneously.
Secondly, using correlated currencies for constructing hedging strategies is a very popular method among some traders. Here market participants can open the same positions with negatively correlated currencies. Alternatively, they can open one long and one short position with positively correlated currencies. In each case, traders can be well-positioned to protect their trading accounts from adverse market movements.
Finally, there are commodities correlated with currencies. For example, the oil price is highly correlated with the Canadian dollar (CAD), Russian ruble (RUB), and Norwegian Krone (NOK). Therefore, Traders can observe the latest trend on the commodity markets and open positions with currency pairs accordingly.
Concept of Forex Correlation
As mentioned before, the currency correlation exists between those pairs which tend to move in the same direction. However, this does not mean that all those securities are tied to each other with the same degree. In fact, traders and financial analysts are using the correlation coefficient to determine the degree of correlation between two currency pairs or commodities.
The correlation coefficient itself can range from -1.00 to 1.00. If this indicator is at -1.00 this means that two securities are perfectly negatively correlated to each other. In other words, they always move in the opposite direction. At the same time, if this measure is at 1.00, this means that two currency pairs are perfectly positively correlated to each other. This means that they always move in the same direction.
Obviously, those are just theoretical cases, in real life trading, there are no such examples, where two currency pairs are 100% positively or negatively correlated. Instead, all currency pairs tend to between -0.99 to 0.99 range, in terms of currency correlation coefficients. Finally, if the coefficient is at 0, it means that two securities have no correlation whatsoever.
Highly Correlated Currency Pairs
In order to better illustrate what is behind this phenomenon, let us compare two Forex charts. The first daily diagram illustrates the price action of the AUD/USD pair during the last 3 years:
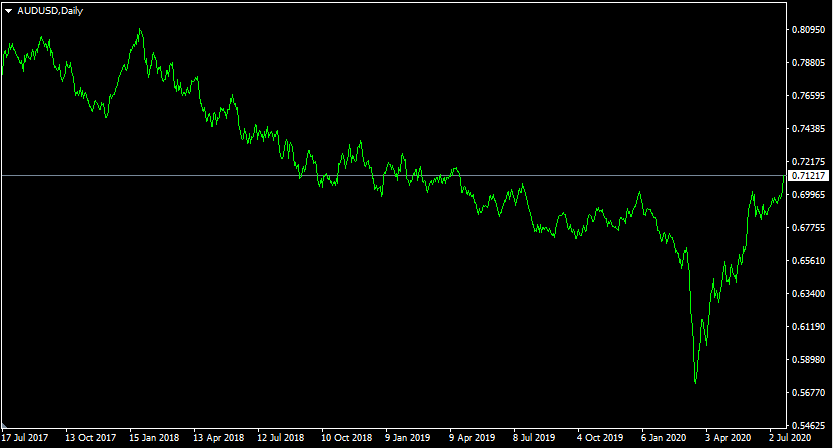
As we can see from the chart above, during July 2017, the Australian dollar was trading close to $0.78 level. After some fluctuations, the AUD did manage to appreciate and even reach $0.81 level by January 2018. However, those gains have turned out to be very short-lived. From February 2018, the Australian dollar started its long term downward trend. As a result of this development, the AUD/USD pair has fallen all the way down to $0.57 level by March 2020.
However, as the panic selling ceased after the March 2020 stock market crash, it marked a turning point for the Australian dollar. During the subsequent months, the AUD has made some consistent gains and eventually went above $0.70 level during July 2020.
So as we can see during this period the Australian dollar has gone through three stages. During 2017 the currency appreciated steadily against the USD. From February 2018 until March 2020, there was a long downtrend for the Australian currency. Finally, from April 2020, the AUD/USD started to recover and even made some notable gains.
Now let us compare this example to this daily NZD/USD chart which covers the same period:
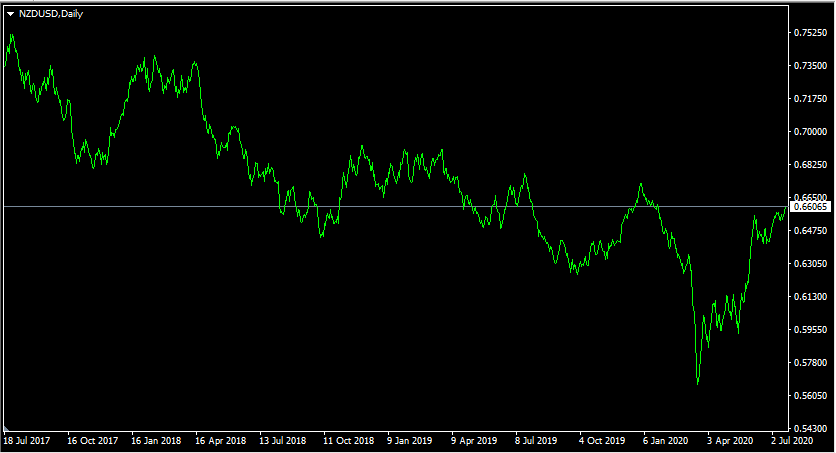
As the above diagram shows, the New Zealand dollar was trading at $0.73 level during July 2017. Despite the initial decline, the NZD/USD pair did manage to regain lost ground and return to the $0.73 mark by January 2018. For the next 3 months, the pair has moved sideways, without experiencing any significant gains or losses.
However, from April 2018, the New Zealand dollar began its long term decline. As a result of this downward trend, by March 2020, the NZD/USD pair has dropped all the way down to $0.56 level. Just like in the case of the Australian dollar, the New Zealand dollar started its recovery from April 2020 and during the subsequent months made some notable gains. By July 2020, the NZD/USD pair trades close to $0.66 level.
So as we can see from this example, the AUD/USD and NZD/USD are indeed positively correlated Forex pairs. Obviously there were points when the exchange rates of those securities diverged somehow from each other. However, if we take a look at those two charts, it’s become obvious that they tend to move in the same direction.
Reducing Trading Risk with Currency Pairs which Have Positive Correlation
At this stage, traders might get some idea about the essentials of this phenomenon. However, the obvious question remains: how to use currency correlation in Forex trading?
Well, the first way traders can utilize the currency pairs correlation is in terms of risk management. The fact of the matter is that by avoiding opening the same positions with highly correlated currency pairs, traders can reduce their risk exposure.

Returning to our previous example, if a trader opened both long and short positions with AUD/USD and NZD/USD, it will definitely not be the case of diversification. Instead, here trader would be essentially on the same side of the trade, in both cases, since those currency pairs tend to move in the same direction.
Here it is also worth noting that the underlying principle remains the same in the case of currency pairs with negative correlation. In this case, traders must avoid opening the opposite positions with two highly negatively correlated currency pairs.
One example of this would be if a trader decides to open the short GBP/AUD and long AUD/USD positions, then this will magnify the risk since the trader is essentially taking one side of the same trade.
Therefore, checking the currency pairs for correlation can be a very prudent step to avoid increasing the risk without even knowing it. In fact, traders do not need to start calculating correlation in Forex currency pairs themselves in order to achieve that. All they have to do is to just consult the currency correlation matrix, which displays the list of all highly positively or negatively correlated currency pairs and commodities.
Alternatively, for more detailed research, traders can make use of currency correlation calculators, which can show market participants the correlation coefficient between two given currency pairs. This tool is available at some Forex news websites, as well as on the webpages of some brokerage companies.
Degree of Correlation
At this stage, some people might still wonder how one can apply all of this information to day to day trading. Well, as mentioned before opening any trades, market participants must make sure that they do not have the same positions with highly correlated currency pairs or commodities.
However, at this stage, it is essential to take note of the fact that not all currency pairs are correlated to the same extent. In some cases, the relationship between them is too weak and it is not worthwhile to make trading decisions based on that.
Therefore, in order to conduct a more accurate analysis, one must check the correlation coefficient between two given securities. For example, if the correlation coefficient between the two currency pairs is 0.10, then they can feel free to open positions with those. The reasoning behind this is the fact that the relationship between those two securities is very weak and has no significant implications on the market.
Therefore, when researching the correlated securities, traders should focus on those who have their correlation coefficients between -1.00 to -0.50 or 0.50 to 1.00 range. When the coefficient for two given currency pairs is higher than 0.50, this suggests that at least most of the time they tend to move in the same direction. Obviously, as close as the coefficient is to 1.00, more significant this relationship becomes.
Consequently, it can be a useful step to avoid opening positions with those currency pairs the degree of correlation is at 0.50 or higher. On the flip side of the coin, the market participants should also avoid opening the opposite positions for those pairs, which have their correlations coefficient at -0.50 or lower.
Using Influence of Currency Correlation in Forex Hedging Strategies
Currency correlation in Forex trading can also be successfully used for the planning and execution of hedging strategies. Those types of techniques focus on protecting the trader’s trading account, regardless of market volatility.
One example of using the hedging strategy is to open two long positions simultaneously with GBP/AUD and AUD/USD. As mentioned before, those are two negatively correlated currency pairs. So in this case, the losses with one pair are very likely to be offset by winnings in the second trade.
For example, if the Australian dollar falls, then obviously the trader will take some losses on the long AUD/USD position. However, due to AUD weakness, it is very likely that GBP/AUD would rise and offset all of those losses. Alternatively, if the Australian dollar strengthens, the trader will lose some money on the long GBP/AUD position, but he or she can make up those losses with the long AUD/USD position.
It goes without saying that when traders are using hedging strategies based on Forex pairs correlation, they do not have to confine themselves into just 2 securities. Market participants can trade 2,4,6 or any even number of currency pairs with a high degree of opposite correlation.
Commodities Correlated with Currency Pairs
Any experienced Forex trader is aware of the fact that some commodities are highly correlated with individual currencies. For example, the latest release of the dairy price index might have very little effect on the exchange rates of other currencies, but for the New Zealand dollar, this can be very significant. This is because New Zealand is one of the largest producers and exporters of dairy products in the world.
Therefore, when the price of this commodity rises, some of the local businesses benefit from increased revenues and potentially higher profits as well. At the same time, the government of New Zealand can also benefit from rising tax revenues.
This is why when the price of dairy products increases, very often it also leads to the appreciation of NZD. The opposite is also true. If the price of this commodity goes down, in many cases the New Zealand dollar also declines.
The same dynamic is in play when it comes to the oil prices and the Canadian dollar, the Russian ruble, and Norwegian krone. In order to illustrate better this relationship, let us take a look at this daily USD/NOK chart:
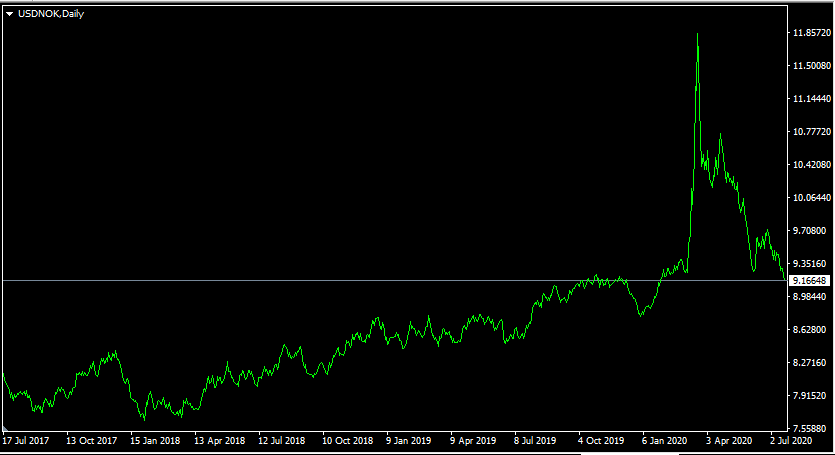
As we can see from the above diagram, the pair was trading at 8.10 during July 2017. During the subsequent months, the USD/NOK has fluctuated considerably, however overall the Norwegian krone had an upper hand. As a result, by March 2018, the pair fell down to 7.65 level. Interestingly, this development coincided with the rise of Brent oil prices. During this period the price of this commodity has risen from $49 per barrel to $69 per barrel.
However, those trends turned out to be short-lived. From April 2018, the Norwegian krone began its long downward trend. By March 2020, the USD/NOK pair has risen all the way up to 11.90 level. At that time the price of Brent oil was already below the $30 mark. However, the price of this commodity later recovered from this collapse and by July 2020 had already returned to $45 level.
This also had a positive effect on the exchange rate of the Norwegian krone. From late March until July 2020, the Norwegian currency made a steady recovery and nowadays trades close to 9.16 level.
So as we can see from this example, the high degree of correlation between some commodities and currencies gives traders an opportunity to make some accurate predictions about the exchange rates.
For example, if the dairy prices rise, then the trader might consider opening the long NZD/USD or short EUR/NZD or GBP/NZD positions. On the other hand, if oil prices fall, then market participants might decide to open long USD/CAD, USD/RUB, or USD/NOK positions. Therefore, traders can observe the latest developments in the commodity markets in order to get some idea about the possible movements of those currencies, which are highly correlated with those securities.
Reasons for Divergence
Despite all of the cases of the currency and commodity correlations persisting for years, it is worth noting that there are some exceptions to this as well. When calculating correlation in Forex trading, it is important to keep in mind that currencies do respond to economic events and in some cases, those old relationships might be temporarily or permanently broken due to various reasons.
One of the obvious examples of this is the relationship between the Australian dollar and the gold price. Australia is one of the largest producers of precious metals in the world and obviously its economy stands to benefit from the increasing prices of those types of commodities.

The reasoning for this is very simple. When the prices of precious metals rise, the revenue and profits of Australian mining companies increase as well. Consequently, the Australian public finances also benefit from this process, since this leads to rising government revenues.
Consequently, for more than 2 decades, the gold price and the exchange rates of the Australian dollar tended to move in the same direction. At some point, this has reached such an extent that some investors looked at the Australian dollar as a proxy for investing in gold.
The fact of the matter is that despite all of its appeal and long term stability, the gold does not pay any interest or dividends to investors. Therefore, for some market participants, it became a convenient alternative to invest in the certificates of deposit (CDs), denominated in AUD, or Australian government bonds.
Those options seemed even more appealing to investors, considering that the Reserve Bank of Australia’s cash rate was considerably higher than that of the majority of the world’s central banks.
However, after more than 20 years of such a relationship, from the second half of 2019, the correlation between the Australian dollar and the gold price was temporarily suspended. As the price of this shining metal increased steadily and eventually returned close to 2011 highs, the AUD lost some ground against the US dollar and some other major currencies.
The reasoning behind this was the fact that during this period the Reserve Bank of Australia started cutting rates consistently, reducing its cash rate from 1.50% to all the way down to 0.25% by March 2020. It goes without saying that rate cuts do make currencies less appealing for investors and traders, consequently, the Australian dollar fell steadily during those months.
However, this divergence did not last for long. After reaching the multi-year low in March 2020, the AUD started to recover and began the new upward trend. Consequently, the high degree of a positive correlation between the Australian dollar and the gold price was restored.
Therefore, it is always helpful to remember that the fact that two currency pairs or commodities are highly correlated with each other, it does not mean that this relationship is set in stone and those tendencies will continue indefinitely. Some economic factors such as interest rate decisions and other important events can significantly alter the old relationships between different securities.
Trading Correlated Currencies – Key Takeaways
- There are essentially two types of currency correlations. Positively correlated currency pairs tend to move in the same direction. At the same time, the negatively correlated currency pairs usually move in opposite directions. This type of relationship not only exists between different currency pairs but also between commodities and individual currencies as well. As a result, some currency exchange rates are tied to the oil price, while others depend upon other commodity prices.
- The degree of correlation between different securities might vary by currency pair and is measured by the correlation coefficient. This indicator can range from -1.00 to 1.00. Here -1.00 represents the cases of perfect negative correlation, while 1.00 denotes the case of perfect positive correlation. However, it is worth mentioning that the degree of correlation between different currency pairs and commodities fall between those two extremes. There are no securities which are 100% correlated with each other.
- Traders can use currency correlation for reducing their risk exposure in several ways. Firstly, they can avoid trading highly correlated currencies simultaneously, since in this case, they would be taking the same side of the trade. Market participants can also use hedging strategies by taking opposite positions with two or more highly correlated currencies. In this way, the losses with one currency pair are highly likely to be offset by the gains with another currency pair. However, it is worth remembering that sometimes the correlated securities might diverge from each other due to various reasons.


