Table of content
The consumer price index, also known as CPI, is one of the most popular measures of inflation. It calculates the overall changes in the price levels by comparing the price changes in the basket of goods and services during the last 12 months.
Now, considering that the majority of central banks around the world are targeting inflation, they do use the CPI to keep track of their progress. This means that if the CPI rises significantly above its intended target, then the policymakers, in general, are likely to consider an interest rate hike to contain the rate of price increases. On the other hand, if the CPI falls well below the goal, then the central bank might lower rates in order to stimulate the economy and get the inflation rate back on track.
However, here it is important to point out that not all central banks use CPI as the main reference point for making monetary policy decisions. For example, the US Federal Reserve gives preference to the personal consumption expenditures index, also known as PCE.
Here it is worth noting that there are indeed several key differences between those two measures of inflation. One of the most important differences is that PCE is essentially a chained type index. This means that the statisticians who measure this index assume that when the price of a product increases significantly, the consumers will buy less of those products. Instead, they will buy more goods and services, the prices of which remained stable or have fallen.
In addition to that, as the Federal Reserve Bank of St. Louis suggests, the CPI is based on a household survey of what consumers are buying, when PCE focuses on what businesses are selling.
There are also some other differences in the measurements, however, the overall result of those is that the PCE index tends to show a lower rate of inflation than the CPI. For example, back in January 2020, according to the PCE, the price levels during the last 12 months have risen by 1.9%. However, at the same time, the CPI has shown the annual inflation rate to be at 2.5%. So there was a 0.6% difference between those two indicators.
It goes without saying that those differences in terms of inflation measurements can have some significant implications on the monetary policy of the US Federal Reserve, as well as on the value of the US dollar against other currencies.
Finally, it is worth noting that there are two types of PCE. We have headline PCE and Core PCE. The difference here is that the latter one excludes the food and energy prices from calculations, due to their higher volatility. So far the US Federal Reserve has given preference to the core PCE measures. Now let us go through each of those details in greater detail.
Alternative Measurement to CPI
It goes without saying that the majority of the world’s central banks have used the consumer price index as a benchmark for their decision-making process without ever raising the possibility of using any other indicator for this purpose.
The consumer price index consists of several categories and subcategories, covering the prices of thousands of goods and services. In order to illustrate this better, we can take a look at the composition of the consumer price index.
The first thing to mention here is the fact that the housing category is the largest component of the US consumer price index, comprising approximately 43% of the CPI. The main reason behind this is the fact that the majority of US citizens do spend a significant portion of their income on rents and mortgage payments.
The second and third places are shared by the transportation and food and beverages category. The former covers the cost of fuel, public transportation, expenses associated with car ownership, and other items related to those themes. This category makes up 15% of the consumer price index.
The food and beverage category includes foods such as bread, cheese, meat, vegetables, fruits, and other essential items for consumption. It also includes drinks such as water, soft drinks, and milk. Since consumers purchase and consume those products on a daily basis, it has a significant portion in the calculation of the index, making up around 15% of CPI.
The fourth largest category is medical care, followed by recreation, education, and apparel. It is also worth noting that the CPI index also has an ‘other’ category. This includes all goods and services which do not belong to housing, foods, transportation, or any other categories. The index is published and updated on a monthly basis.
The US Federal Reserve also used CPI as a guiding indicator for making monetary policy decisions and adjustments until 2000. However, after 2000, the US policymakers have decided to adopt PCE as their preferred method for measuring the inflation rate. Now, the official explanation for this decision was that PCE was a more inclusive measurement, covering a larger variety of goods and services than the consumer price index.

Now, here it is worth pointing out that despite this decision by the Federal Reserve, the US Federal government still maintains CPI as a guideline for adjusting social security payments to its citizens.
As mentioned before, the PCE focuses on actual consumer expenditures, hence its name. The data is gathered from businesses that report their recent sales. On the other hand, the CPI surveys households in order to construct and regularly update the basket of goods and services to measure inflation.
It goes without saying that this difference in methodology is significant, however, it might not be the main reason why those two indicators show different inflation rates. The fact of the matter is that PCE is a chained type of index. This means that it actively uses substitutions with products depending on the price changes. So it is entirely based on the substitution theory.
This theory itself suggests that over time, consumers tend to substitute those goods with rising prices, with the ones the price stays stable or falls. In order to understand this principle better let us take an example of two goods A and B. Let us suppose that the price of A has risen from $5.00 to $5.50, while the price of B remained unchanged at $5.00. So what will be the average inflation rate in this case based on only those two goods?
Well, the answer here seems quite simple. The price of one good has risen by 10%, while the price of the other remained constant. Consequently, the average inflation rate here will be 5%.
However, with PCE things are not so simple. The fact of the matter is that the statisticians who calculate PCE will assume that since good A became more expensive, people will buy more B goods than before. So they might reduce the weight of good A to 40% and increase the weight of B to 60%. As a result of this change, the inflation rate will be 4%, instead of 5%.
It is not surprising then that there are many people who criticize those types of chained measurements and try to come up with other more reliable indicators. The very definition of inflation is the overall increase in the price levels. Consequently, the main criteria for a good indicator of inflation is for it to show accurately the changes in the overall price levels of goods and services.
So the best way to achieve this is to take a fixed basket of goods and services and keep track of their prices on a regular basis. Obviously, one can adjust the basket on an annual basis or at other frequencies. However, simply assuming that people will switch to products with lower prices is indeed one reliable way to understate inflation.
It is true that as a result of price increases in many cases consumers might decide to switch to cheaper products. However, this does not mean that those goods and services will be of the same quality. This simply means that if any government decides to use PCE for social security payments, its citizens will simply be unable to maintain the same living standards as before. This might be one of the main reasons why the US government has decided to keep using CPI for social security payment adjustments.
Inflation DIfferentials Between CPI and PCE
It is not surprising that those differences in methodology of calculation led to some degree of divergence between those two indicators. Just to bring up one example of this, back in January 2000, the CPI inflation rate stood at 2.8%, when PCE only showed 2.2% as an annual inflation rate. So here again, we can see that there is a 0.6% difference between those two indicators. Now, for the sake of accuracy, it is important to point out that the gap between them sometimes widens and in some cases becomes narrower. For example, back in February 2019, the CPI was only 0.1% higher than PCE.
However, as the data provided by the Federal Reserve Bank of St. Louis suggests, from 1959 until 2018 the average CPI rate was 0.5% higher than PCE. This might not seem a very large amount of difference for some observers. Yet, it is important to keep in mind that this represents the average annual differential. It goes without saying that over a long period of time it can certainly add up to a significant amount.
In addition to that, it is helpful to mention that the US Federal Reserve officially targets the 2% inflation rate. However, as we have discussed, the US policymakers are using PCE as their preferred measure for inflation. So if the PCE on average is 0.5% lower than CPI, then it turns out that the US Federal Reserve is effectively targeting a 2.5% CPI rate, instead of 2%. In order words, back in 2000 when US policymakers decided to move on to PCE, they had effectively raised their inflation target rate by 0.5%.
It goes without saying this had a significant impact on the monetary policy of the US Federal Reserve. Let us take an example where the CPI rate stands at 2.5%. So as we can see it is notably higher than the 2% target rate, so at this point, the central bank might consider raising rates.
However, if the policymakers are using PCE, which understates inflation by 0.5%, then it will show that the rate of price level rises is at 2%. Consequently, the policymakers will conclude that the inflation rate is exactly on the target and there is no need to make any decisions.
On the other hand, if the CPI is at 2% and PCE at 1.5%, then the central bank might become concerned about the fact that the inflation rate is below the target and then resort to cutting interest rates. Something which would not be needed if policymakers used CPI as a benchmark.
Impact of PCE on the Forex Market
So far, as we can see here this decision to choose PCE as a reference point for making decisions, made the monetary policy of the US Federal Reserve more dovish. Obviously, at this point, many people might wonder whether or not this had any impact on the Forex market. Well, in order to accurately answer this question, let us take a look at this weekly EUR/USD chart:
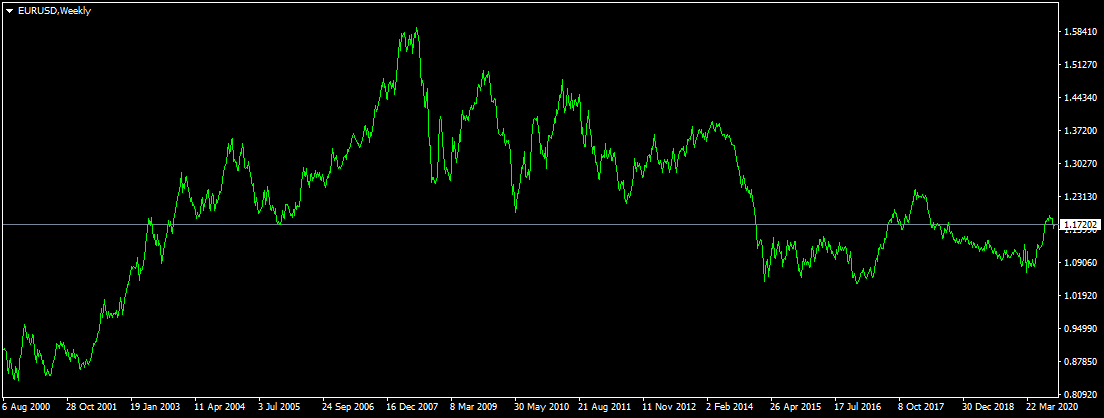
As we can see from the above diagram, back in 2000, the US dollar was at the height of its strength, with EUR/USD trading at $0.83 before the end of that year. This show of strength persisted until March 2002, when the Euro’s exchange rate remained well below $0.90 level. However, after this development, the EUR/USD began a long term upward trend, making consistent gains over the years, eventually rising all the way up to $1.59 level.
However, despite making those impressive gains, from August 2008, the single currency began its long term decline. There was a great deal of volatility, but by the end of September 2020, the EUR/USD pair had traded near the $1.17 level.
So what can we conclude from those developments? Well, actually we can make several conclusions from this chart. Firstly, as we can see that the Federal Reserve did make the major change of moving from CPI to PCE, however, the market reaction was not immediate. In fact, the USD strengthened persisted well into the first quarter of 2002. This is because back in 2000, the market has not yet fully digested the implications of such a major monetary policy decision.
On the other hand, as the US Federal Reserve started to actually cut rates and generally became more dovish, it started to take a toll on the value of the US dollar. It is not surprising then that the EUR/USD pair has risen by more than 90% during the subsequent 6 years.
However, at this point we have to address the obvious question: If moving to the PCE had such a significant impact, then why did the Euro start to decline from August 2008? How is the US dollar able to wipe out most of its losses during the subsequent years?
Those are indeed very valid and logical questions. There are several factors at play here. Firstly, despite the monetary policy having a major impact on the currency markets, it is not the only decisive factor entering into the equation. For example, back in 2008, there was a massive flight to safety, as investors liquidated most of their assets in other currencies and moved them to the perceived safety of US treasuries, certificates of deposit, and savings accounts.
In addition to that, it is important to remember that when it comes to the exchange rates of a given currency pair, both central banks have a significant impact on the market. So in this case, the policy of the European Central Banks has changed dramatically in 2008. It is worth keeping in mind that before August 2008, the ECB had increased its key interest rate all the way up to 4.25%.
However, faced with the enormous challenges of the 2008 Financial Crisis, the ECB responded by reducing its key Interest rate all the way down to 1% by May 2009. At that time the European policymakers also had to tackle the challenges of the Eurozone Sovereign Debt Crisis. At that point, it seemed unclear whether or not the Eurozone would survive this crisis, so the ECB has reduced rates further, all the way down to 0% by 2016. In addition to that, the European policymakers also conducted quantitative easing.
The results of those policies were quite predictable. The US dollar managed to regain its strength against the Euro and recovered most of its losses. Going forward, the future exchange rate of EUR/USD will depend upon the relative policies of the US Federal Reserve and the European Central Bank, as well as on a number of economic indicators.
However, one thing to remember here is that the core PCE reports in the US do have a sizable impact on the USD exchange rates. This is because the market participants assume that the US policymakers will respond to the latest changes in this indicator. This is not to say that US CPI is entirely irrelevant in the economic calendar. It can impact the US dollar, however, one thing to keep in mind here is that when here the Federal Reserve is effectively aiming for 2.5% CPI, rather than 2%.
Impact of the Wording of Central Bank Mandate
Before moving on to the other details about PCE, it is important to mention that it is not only the exact amount of inflation target which influences the Forex market but also the wording of the mandate as well. For example, as mentioned before, the US Federal Reserve aims to keep the PCE inflation rate at 2%. At the same time, the Swiss National Bank has a goal to keep the Swiss CPI inflation below 2%.
This means that the Swiss policymakers are likely to be very happy with a 1% or 1.5% inflation rate and do not take any major decisions if there is no threat of deflation. The long term result of this policy was the fact that over the years the Swiss franc had a much lower rate of inflation than the United States.
Does this have any notable impact on the exchange rates of those two currencies? Well, in order to respond to this question accurately, let us take a look at this daily USD/CHF chart:
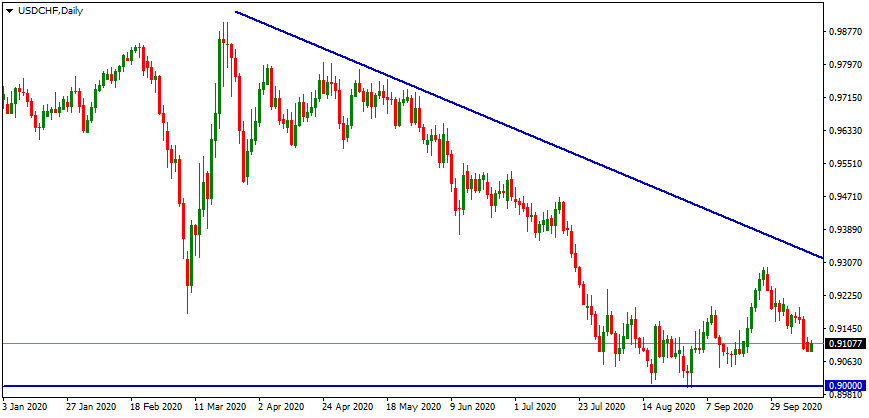
As the chart above shows, at the beginning of 2020, the USD/CHF pair were trading close to 0.97 level. Initially, the US dollar has made some notable gains, however, the reaction of the Forex market on the March 2020 stock market crash was the large drop in the USD/CHF pair during the middle of the month. However, this decline was short-lived. In fact, the US dollar has led a V-shaped recovery, eventually rising all the way up to 0.99 level.
At this stage it seemed like that the parity was well within reach for the US dollar. After all it only took 100 pips to break above this level. However, here it is worth remembering that at the same time the US Federal Reserve has cut rates all the way down to 0% to 0.25% range. Consequently, the currency lost appeal to some traders and investors.
Consequently, the pair began to decline, eventually dropping all the way down to 0.90 level. As we can observe from the diagram, the pair still remains within a downward trend. However, it is also worth pointing out that so far the psychologically important 0.9000 level so far held its ground. Obviously, if at some point the pair manages to break below this key support level, it can be a major bearish sign and could open the way to 0.85 level.
So the obvious question here is why USD/CHF has such a hard time breaking above the parity level? After all, the Swiss National Bank holds rates at -0.75%, essentially penalizing some depositors for holding savings accounts and certificates of deposits in Swiss francs.
Well, one of the main reasons for this is the mandate of SNB. They are just aiming to keep inflation below 2%, but the price levels in Switzerland remained mostly flat since 2008. So since the Swiss franc retains its value so well against other currencies, it tends to appreciate against its peers.
Why has the US Federal Reserve has Chosen PCE as Benchmark?
At this point, some people might have a logical question: Why has the US Federal Reserve chosen PCE as a measuring rod for inflation? Why are not US policymakers using CPI for this purpose, just like so many other central banks across the globe?
Well, actually, there are both official and unofficial explanations for this. Let us begin with the former one. James Bullard, the Chief Financial Officer and President of the Federal Reserve Bank of St. Louis provides the following reasons for this: The expenditure weights in the PCE can change as people substitute away from some goods and services toward others, it includes more comprehensive coverage of goods and services, and historical PCE data can be revised.
It goes without saying that everything else being equal, one might prefer the inflation index which does cover a wider range of products and services. It is indeed also helpful for the historical PCE data to be able to be revised.
However, as mentioned earlier that the substitution effect can easily lead to underestimation of inflation. With this type of approach, the reported rate of inflation can be considerably lower than the actual average increases in the cost of goods and services.
Now, let us move on to other reasons, which might not have been mentioned by the members of the US Federal Reserve Board. Firstly, here it is useful to remember that the majority of the central banks in the world have a single mandate of price stability. This means that their only goal is to keep the inflation rate close to the intended target, whether it will be 2%, 3%, or any other specific level.
However, this is not the case with the US Federal Reserve. In the US the central bankers have the so-called a dual mandate of maintaining price stability and full employment. So by price stability, the US Federal Reserve means to keep the PCE inflation rate at 2%, which is roughly equivalent to a 2.5% annual CPI rate.
The full employment mandate does not mean that the US policymakers have to try to keep the unemployment rate at 0%. Many economists and central bankers believe this to be a totally unrealistic and unsustainable target. So they are aiming at a 5% unemployment rate, which is much more realistic to achieve and sustainable goal as well.
Specifics of Dual Mandate
It goes without saying that having both the inflation and unemployment rates at reasonable levels is indeed very helpful for the economy. However, the obvious problem here is that sometimes those two goals might contradict each other.
It is true that in most cases inflation and unemployment tend to have a strong negative correlation with each other. This essentially means that they tend to move in opposite directions. However, there can be many cases where economic events can disrupt those patterns.

For example, if the economy faces the oil supply shock, then the oil prices will start rising. Consequently, this can lead to an increase in price levels, since the cost of fuel will rise. This in turn can make the cost of goods more expensive, since businesses have to pay more for their transportation. At the same time, the oil supply shock can also increase the unemployment rate, since businesses will have the less disposable income to hire more workers and pay their wages.
In this situation, the US Federal Reserve will have a dilemma. They can either raise the interest rates and combat the inflation rate. Or alternatively, they can reduce rates to stimulate the economy and possibly reduce the unemployment rate. It is a difficult choice, so that is why the US policymakers need some flexibility to conduct their monetary policy effectively.
So the decision to substitute CPI with PCE had an effect of raising the effective target rate for inflation by 0.5%. This gave the US policymakers a greater degree of flexibility in order to tackle potential unemployment problems at several points in the future.
Another major consideration here is the future US Fiscal policy. The fact of the matter is that the US national debt has surpassed $26 trillion, with the annual deficit for the fiscal year 2020 reaching $3.3 trillion. In comparison, back in 2016, the annual budget deficit was at $587 billion. It does not take an advanced knowledge of the economics and finances to understand that this policy is unsustainable.
Without reversing this policy and reducing the budget deficit to more reasonable levels, there will be a sovereign debt crisis. Therefore, from the point of view of public finances, it is better for the central bank to tolerate higher levels of inflation, than before. This is because if those debts would be devalued at a faster pace, then it will be easier to repay them. As a result, this will make it more likely for the US to emerge from the possible future debt crisis more or less intact.
In fact, it is even possible to entirely eliminate the budget deficit as well. For example, during the Clinton administration, back in 1993, the US budget deficit fell every year, until in 1998 it moved to the budget surplus. This surplus has persisted for 4 years and at one point has even reached $236 billion.
The third reason for the US Federal Reserve adopting PCE as a target is the historical inflation data in the United States. It goes without saying that over the years, the inflation rate in the US has varied considerably. There was a period of deflation during the Great Depression. On the other hand, the US has experienced persistently high levels of inflation during the 1970s. However, the long term average CPI rate is close to 3%.
Consequently, achieving the reduction of the average inflation rate by 1% to 2% is not an easy task, especially considering the fact that the US policymakers must take the unemployment rate into account. Therefore, it is much easier to achieve a 2.5% CPI rate, than 2%. So in this respect, this decision has certainly made the job of the US Federal Reserve much easier.
Headline vs Core PCE
When discussing the personal consumption expenditures index, it is worth noting that there are two types of PCE. We have the headline PCE and core PCE. The former includes all categories of goods and services. On the other hand, in the case of the core PCE, the indicator excludes fuel and food prices from its calculations. The rationale behind this is that food and transportation are the two most volatile items in the inflation measuring indices.
The US Federal Reserve usually gives preference to the core PCE when making monetary policy decisions. However, it is worth pointing out that this view is not shared by all members of the board. For example, James Bullard mentioned in his articles that he thinks that the headline PCE should be the most important measuring instrument for inflation when the US Federal Reserve makes policy decisions.
Many economists and financial commentators share this view because food and fuel products are some of the most frequent consumer products on the market. Consequently, it makes very little sense to omit them from inflation calculations.
On the other hand, there are also financial experts, as well as central bankers who argue that many changes in the food and fuel prices are transitory. For example, back in 2011, due to an increase in fuel prices, the inflation rates in the US and Eurozone surpassed the 3% mark. The US Federal Reserve maintained its monetary policy unchanged.
On the other hand, the European Central Bank responded with two rate hikes. However, after some months, the inflation rate came down significantly and the European policymakers had to reverse their policy. So in this case, by targeting core PCE, the central bank is supposed to increase the accuracy of its monetary policy decisions.
Differences Between US PCE and CPI – Key Takeaways
- The US personal consumption expenditures index, also known as the PCE, is an alternative measure of inflation. There are some differences between PCE and CPI. The latter one focuses on household surveys, constructing a basket of goods and services. On the other hand, PCE focuses on what businesses sell to customers. In addition to that, the PCE is a chained type of index, using substitution theory.
- Due to the differences in methodology, the CPI inflation rate on average tends to be 0.5% higher than the PCE. Since 2000, the US Federal Reserve has used PCE as its preferred measure for inflation. Because the US policymakers are targeting 2% PCE, this effectively means that they are targeting a 2.5% CPI rate.
- The US Federal Reserve has a dual mandate, maintaining price stability and full employment. Consequently, the US policymaker does have to balance between those two goals. Therefore, even if the PCE rises above its intended target, the central bank might still be reluctant to raise rates if the unemployment rate remains high.