Table of content
The price to earnings ratio, also known as the stock P/E ratio is one of the most popular measurement instruments in the stock market valuations. For some new investors, this might sound like a complicated term. However, the P/E ratio formula is indeed quite simple. In fact, one even does not need a special P/E ratio calculator in order to come up with this number.
All an individual has to do is to divide the current market price of the individual stock to the earnings per share indicator, also known as the EPS. Here it is worth noting that there is no universally accepted theory of what is the optimal P/E ratio investors should look for. However, the general consensus is that if this indicator is above 20, then the stock is on the overvalued territory.
The P/E ratio has several uses. Firstly, it gives some idea to the market participants about how reasonably priced the individual stock is. It goes without saying that this can be very handy when making investment decisions. In addition to that, when investors have several decent stocks to choose from, the P/E ratio can help them to compare the valuations of those securities and choose the one which offers the best value.
Therefore, it goes without saying that the P/E indicator is helpful in many ways. However, just like any other indicator, it does have its own weaknesses. Firstly, the calculation of this indicator entirely depends on the current earnings of the company. Therefore, if the firm posts a loss, then one simply can not come up with the P/E ratio and has to look for other ways to value the stock.
Another major implication of this indicator is that it is only based on the latest earnings of the company. Consequently, if the firm faces some major headwind which might temporarily reduce its profits, then the P/E ratio might show the stock as being overpriced, which might be misleading.
Therefore, the price to earnings ratio is not perfect and generally, it is better to be used in conjunction with other stock market indicators, when making investment decisions.
What does P/E Ratio Mean?
When it comes to choosing stocks to invest, people generally tend to look at their investment style, the profitability of the company, the dividend history, beta, past stock price performance, and many other indicators. However, the fact of the matter is that even if the individual security passes all of those tests, even if it has an impressive past price performance, solid dividend history, and rising profitability, it still does not mean that investors should buy the stock.
This is because the stock can be sometimes extremely overvalued. As a result, in the future, it might face some healthy correction. This is not because of the failure of the management or the business model. This is because, as some experienced investors might say, the company’s earnings have to catch up with the current market price.
In order to illustrate one case of such a scenario, let us take a look at this long term Coca-Cola Company (KO) stock price chart:
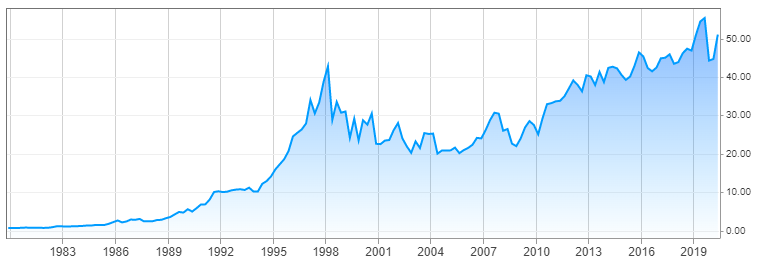
source: cnbc.com
As we can see from the above image, the shares had quite an impressive run not only during the 1980s but also most of the 1990s as well. The result was that adjusting for stock splits, the shares had risen from just $0.65 to well above $42 by 1998. It goes without saying that by that time the stock became significantly overpriced.
As a result, the prices faced a major correction and the shares mostly moved sideways for a number of years, until resuming their upward trend from 2009, recently trading at $51 level. The Coca-Cola company stock has delivered a consistently increasing dividend to shareholders for several decades.
However, if someone disregarded the extreme overvaluation of the stock and purchased those shares back in 1998, then they had to wait for several years before, they could recover their original investment amount.
Therefore, as we can see from this example, every investor needs some sort of reliable measurement for the stock valuation in order to avoid purchasing the stocks in times of their extreme overvaluation. This is exactly where the price to earnings ratio comes into play. By calculating the P/E ratio, the market participants can get at least some idea about the current valuation of different stocks.
So the obvious question at this point is: how to calculate P/E ratio? Well in order to come up with this number, investors just need two components. The first part of the equation is the current market price of the security. This is an easy task. After all, one can find the latest stock market quotes from any stock news website, as well as on the webpages of many financial outlets.
The second part of the price to earnings ratio formula is the earnings per share indicator, also known as EPS. This indicator divides the total amount of earnings of the company on the number of outstanding shares. So in order to come up with a P/E ratio, one has to divide the current stock price on the Earnings per share indicator. For example, if the stock currently trades at $60 mark and its EPS is at 3.75, then the current P/E ratio will be at 50 / 3.75, which equals 16.
Analyzing P/E Ratios
Now let us suppose that an individual investor has gone through the P/E ratio formula explanation. However, in order to successfully use this indicator, one has to know how to interpret the meaning of those numbers.
Therefore, it is worth mentioning that according to the rule of thumb for P/E ratio formula and calculation, if this indicator is below 15, then it is generally considered to be undervalued. At the same time, if the ratio is above 20, then many investors believe the stock to be overpriced. Consequently, according to this rule, the security is reasonably priced if the P/E ratio is between 15 to 20 range.

So returning to our previous example of Coca-Cola Company stock, its current stock price, in September 2020 stands near the $51 mark. The latest earnings per share indicator is at $2.12. This means that its P/E ratio is 51 / 2.12, which is approximately 24.06. This suggests that at current prices this stock might be slightly overvalued.
On the other hand, if at some point in the future, this stock price was to drop down to $40 level, with the same EPS earnings, then its P/E ratio will go down to 40 / 2.12, which equals 18.87. In this case, according to this rule, the stock will be reasonably priced.
In fact, the market participants can use standardized P/E ratio formula, in order to calculate the favorable entry points in the stock market. By multiplying the earnings per share indicator to 20, the market participant can find out the maximum price level at which the security will be reasonably priced. So in this case, if we calculate the result of 2.12 x 20, then the outcome will be $42.40. This means that the Coca-Cola stock will once more become reasonably priced if it drops down to $42.40 level.
To understand the mechanics behind this, let us take a look at another example. This chart shows the price developments of Barclays stock, listed on the London Stock Exchange:
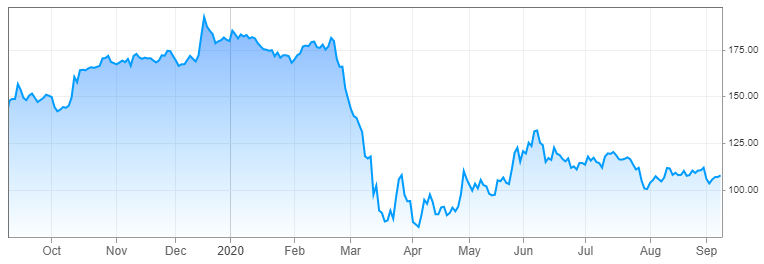
source: cnbc.com
As we can see from the above diagram, the stock had quite a decent run during the second half of 2019, rising from 150p to 180p. However, those gains eventually turned out to be quite short-lived. During the March 2020 stock market crash, the Barclays shares also fell dramatically, dropping all the way down to 85p. During the subsequent months, the stock recovered some portion of its recent losses and by September 2020, it trades near the 108p level.
The earnings per share indicator of the stock currently stand at 6.26p. This means that the price to earnings ratio, also known as the P/E ratio is near 17.25. Therefore, this represents an example of the P/E ratio, which suggests that the stock is currently reasonably priced.
At this point, some people might ask a very logical question: if the stock is currently reasonably priced, then what is the price after which the security will become expensive? Well, if the bank maintains the same level of earnings then that point would be at 6.26 x 20, which is 125.2p. So as long as the current market price remains below this level it might be a reasonable point of entry for buyers of the stock.
Now, here it is worth noting that the earnings per share indicator itself are not a static measure. It changes constantly as the firm publishes its quarterly and annual earnings. Therefore, if those revenues expand, then it might justify higher prices. For example, if in the future, the EPS of this stock rises to 10p, then even if the share price rises to 200p, its price to earnings ratio will be at 20, so it still will not cross into the overvalued territory.
Two Types of P/E Ratios
When discussing the P/E ratio, stock traders should be aware that there are actually two types of the price to earnings ratio. Firstly, we have a trailing P/E ratio. This indicator uses the past 12 months of company earnings to calculate the earnings per share measure.
This means that if the stock price of the firm stands at $30 and the EPS for the last 12 months is at $2.50, then the trailing P/E ratio will be at 12, suggesting that the stock is currently undervalued. The trailing P/E ratio is the most common method used in stock valuations. In fact, the majority of the financial outlets and stock news websites use the trailing price to earnings ratio in their articles and charts.
However, when it comes to those measures, there is another indicator for this purpose, known as the forward P/E ratio. The main difference here is that the latter indicator uses the analysts forecast for the future company earnings in order to come up with a forward P/E ratio. So it is very much a forward looking indicator.
Each of those two measures has its own advantages and disadvantages. However, there are some good reasons, why many investors and financial commentators might prefer using the trailing P/E ratios in their daily analysis. The fact of the matter is that this indicator is based on actual results, something which already took place. On the other hand, the forward looking P/E ratio completely relies upon the analyst’s forecasts.
It goes without saying that there are several problems with this method. Firstly, it is true that in many instances analysts might get their forecasts right. However, this does not mean that this will always be the case. It might happen that the analyst forecasts might be wrong from time to time.
In addition to that, those financial experts make their predictions, based on the information they currently have at hand. However, they might not be aware of some major factors or events which might have a significant impact on the future company earnings. It is also possible that there might be some major economic or political events, which might alter significantly the business activities of the firm.
One of the recent examples of this was the outbreak of the COVID-19 pandemic. As late as January 2020, there were many optimistic forecasts about the earnings of hundreds of firms. In fact, by that time very few analysts would have predicted the scale of the economic damage this pandemic and the subsequent lockdowns have done to the world.
Consequently, it is hardly surprising that during the subsequent months those analysts were forced to revise down their forecasts several times. Therefore, all those people who relied upon the forward P/E ratios for making the investment decisions might have purchased some significantly overvalued stocks without even knowing it. Consequently, in many cases, the trailing P/E ratio might be a more reliable indicator for daily use, rather than forward P/E ratio.
Imperfections of P/E Ratio
As we have already seen in several instances, the P/E ratio indicator can be a very handy tool for valuing stocks, as well as for making investment decisions. However, the reality of the matter is the fact that, just like any other stock market indicator, it is far from being a perfect measurement and can not guarantee a 100% success rate.
Firstly, it is worth noting that one of the most important weaknesses of the P/E ratio is the fact that it can not measure the stocks of those companies which operate at a loss. This is because one of the essential components of this indicator is the price to earnings measure. Therefore, one can not calculate the P/E ratio if the firm has no current earnings to speak of.
This became especially apparent during recent months. As hundreds of companies across the world lost billions of dollars in revenue, some of them ended up reporting quarterly or annual losses. However, the stocks of those companies are definitely worth more than zero, since they do have some assets to speak of, as well as the potential to recover from this recent economic downturn.
In order to evaluate the stocks of those types of firms, some market participants calculate the price to sales ratio. As the name suggests, this measure divides the total annual sales amount to the number of currently outstanding shares and then divides the current stock price on those sales figures.
For example, let us suppose the company stock price is at $25. The firm has recently reported an annual loss, so there is little point in trying to calculate the P/E ratio. So in this case some investors might calculate the sales per share indicator. So if this number is $1, then by dividing 25 to 1, the price to sales ratio of the stock will be 25.
Obviously, sales are not the same as profits. After all, the majority of businesses spend a significant portion of the revenue on such operating costs as salaries, rents, utilities, equipment, and other expenses. Consequently, this indicator might not be as useful as the P/E ratio, but at least it can give some guidance to the investors regarding the latest financial performance of the individual company.
Another major weakness of this indicator is that the P/E ratio has a hard time valuing the stocks of those companies which have absorbed some large one-off shocks but are not recovering.
One obvious example of such a scenario is that of GlaxoSmithKline, also known as GSK. This firm is one of the largest pharmaceutical companies in the world and is listed on the London Stock Exchange. The fact of the matter is that several years ago, the firm was involved with the legal disputes with the government, regarding the amount of fines the firm had to pay for violating some regulations. The judicial process has dragged on for several years. So the management of the firm has decided to settle the matter through negotiation ones and for all and then move on with their business. So eventually, the total costs of settling this matter were near $3 billion. Therefore, it is not surprising that the overall amount of company profits for the year was much lower than during the previous, as well as the next years.
Consequently, if the market participants at that time made their stock evaluations solely using the P/E ratio, then their conclusions would have been wrong. The fact that the firm management has decided to settle the legal disputes with large lump sum payments does not mean that the company has lost its profitability or would stop all future dividend payments.
Actually, it was quite the opposite. It was highly likely that in the long term the firm has saved them money on future legal costs, by settling the matter with negotiation. In addition to that, the firm has never stopped paying dividends to shareholders. As for the stock price performance, to illustrate this, we can take a look at this chart:
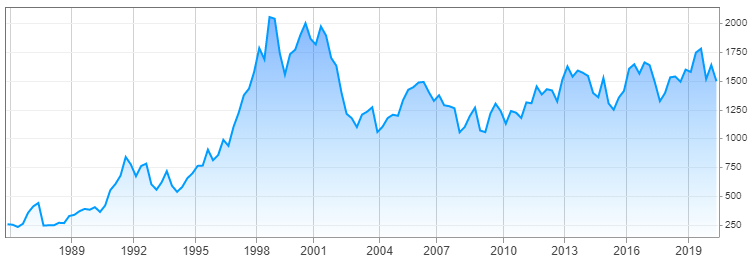
source: cnbc.com
As we can see from this diagram, during the mid 1980s, the GSK shares were trading near the 200p level. During the subsequent years, the stock has made some massive steady gains, eventually surpassing the 2,000p level during 1998. However, at this point, the shares became extremely overvalued. Consequently, during the following years, the GSK shares have faced a major correction, falling all the way down to near 1,050 level by 2009.
However, from this point onwards, the stock started to recover. It did face a healthy degree of volatility, but generally, the security remained within the long term upward trend. As of September 2020, the shares trade close to the 1,500p level. According to the latest date the earnings per share indicator of the firm currently stands at 134.63p. This means that the current price to earnings ratio of this stock is at 11.14. This suggests that at current prices the stock can be significantly undervalued.
Basics of P/E Ratio Indicator – Key Takeaways
- The price to earnings ratio, also known as the P/E ratio is one of the most popular and useful measurements used in stock price valuations. It is calculated by dividing the current market price of the stock to the earnings per share indicator of the company.
- When it comes to the P/E ratio indicator, the general rule of thumb is that the stock is reasonably priced if this indicator falls within 15 to 20 range. If the price to earnings ratio is above 20, then the security is generally considered to be overvalued. On the other hand, if the P/E ratio is below 15, then the stock is deemed to be undervalued.
- Despite all of the usefulness of the P/E ratio indicator, it does have certain weaknesses. One of them is the fact that one can not measure the stocks of those companies which are operating at the annual loss. So in those cases, investors have to look for alternative measurements.