Table of content
The Gross Domestic Product, also known as GDP measures the total value of goods and services produced within a given country during the year.
There are 4 components of Gross Domestic Product. With the majority of the world’s countries, the Consumption makes up the largest portion of the GDP. This component represents the household spending. Because of the large size of this component, any change in consumer spending levels can have a significant impact on the overall rate of economic growth.
The second component, the Investment, accounts for the business investment. This includes the company expenditures of equipment, machinery, and technology.
Government spending represents the third category. This includes all public spending, including military, welfare, healthcare, education, and other items. It is worth noting that this component also takes the salaries of public employees into the account as well.
Finally, the fourth component is called the ‘Net Exports’. As the name suggests, this measures the balance between exports and imports of a given category. Unlike, with previous categories, Net Exports can be represented by the negative number. This happens if the country is running a trade deficit. On the other hand, a trader surplus promotes higher levels of economic growth.
When discussing this subject, it is important to mention that there are several types of Gross Domestic Product. The nominal GDP measures the total value of goods and services produced in a given country within the year, without taking the population or inflation into account.
On the other hand, the real GDP adjusts the latest those numbers according to the overall price level changes. The latter term is also known as the ‘deflator’
There is also a GDP per capita. This measure divides the nominal GDP figures to the number of population in a given country. Therefore, this is considered one of the measures of the level of living standards in a given nation.
The GDP is also one of the most important indicators of the overall strength of the economy. This is why the latest releases of economic growth figures can have a meaningful impact on currency exchange rates.
Understanding Gross Domestic Product
At this stage, many market participants might be still wondering about what drives the GDP. Well in order to illustrate this much better, let us take a look at the Gross Domestic Product formula:
Y = C + I + G + NX
This formula represents the GDP main components. Y stands for the Gross Domestic Product itself. The C denotes the Consumption component, the I stands for Investment, while G is representative of the Government Spending. The last component, which is the Net Exports, is represented by NX.
So as we can see from this formula, the statisticians of a given country, have to first calculate the value of each category separately and then come up with the sum of those components.
To illustrate how each of those elements affects the overall size of the economy, let us take a look at the composition of the US GDP:
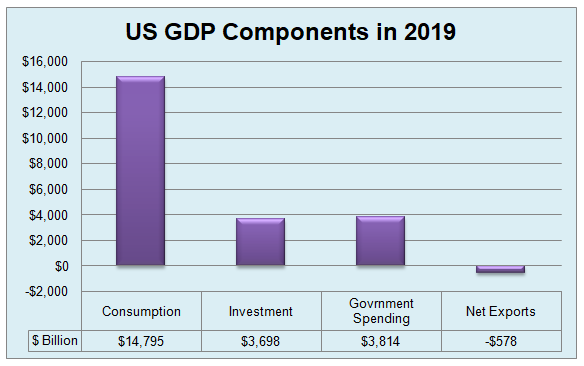
As we can see from the diagram above, in the case of the United States, Consumption is the largest component of the Gross Domestic Product. It makes up a larger portion of the indicator, then all other GDP major components put together. At the same time, Investment and Government spending represent much smaller portions of GDP and have a very similar size.
Because of the fact that the US is running a trade deficit, the Net Exports category here is represented by the negative number. This means that when the NX part of the formula is negative, it takes away some portion of the overall size of GDP, instead of adding anything to this measure.
Now, in order to better understand what Is Gross Domestic Product, let us go through each of those 4 main components in greater detail.
Components of GDP Explained: Consumption
Due to its sheer size, in the case of the majority of countries, Consumption is the most important component of the Gross Domestic Product. In the United States, this category makes up more than 2/3 of the overall GDP, contributing $14,795 billion annually to the US economy.
This component covers all areas of household spending. This includes consumer expenditures on food, shelter, apparel, medicare, education, recreation, and other items. It goes without saying that any major changes in household spending or consumer confidence, in general, can have major repercussions on the overall economic growth rate of the nation.

This is exactly, why not only the latest GDP figures but also retail sales and consumer confidence index (CCI) announcements can lead to significantly higher volatility in the Forex market.
In fact, back in 2008, during the global financial crisis, it was the collapsing consumer confidence, which predicted the upcoming economic downturn, months before it was confirmed by the latest GDP numbers.
The reasoning behind this is very simple. When the consumers in a given economy lose confidence, they tend to spend less. In the US, if households decide to cut their expenditures by 3%, it can reduce the GDP by 2%. Therefore, having consumer confidence is essential for maintaining economic growth in the long term, since its effects on GDP is considerable.
Advantages of Investment Driven Growth
The second component of GDP is represented by the Investment component. Under normal circumstances, the majority of businesses always try to expand their activities and potentially increase their profitability in the process. To achieve this, they typically invest in new equipment, technology, and even in the trading of their employees, in order to boost their productivity. In the case of the United States, this component contributes $3,698 billion to the overall economy.
Here it is worth noting that in one sense, the growth of the Investment component might be more advantageous to the overall economy, then consumption. The reasoning behind this is the fact that when households increase their expenditures considerably, it does promote higher economic growth, however, at the same time, it usually leads to notably higher rates of inflation.
Here we are dealing with the basic economic law of supply and demand. So if the supply remains unchanged, but the demand rises, it will inevitably lead to higher prices. Faced with higher inflation rates, a responsible central bank has to raise its interest rates in order to restrain the growth rate of the overall price levels. Obviously, higher inflation rates are not beneficial for consumers themselves either, since their savings and income are both losing their purchasing power.
Now, on the other hand, the investment driven economic growth does have the same effect of boosting GDP. However, unlike in the previous case, it does not necessarily promote higher inflation rates in the process. The fact of the matter is that by investing in machinery, technology, and training, firms can achieve a higher level of productivity and also reduce the actual cost of production.
Let us now return to our basic economic law of supply and demand. If the supply rises, while the demand remains the same, then it has the effect of falling prices. So as we can see in some cases, the Investment driven economic growth can increase the GDP levels, with downward pressure on the price levels. It goes without saying that this can be very beneficial for the country’s consumers and increase their living standards considerably.
Many governments across the globe have already determined the benefits of business investment in their analysis of GDP. This is why in many nations, the policymakers try to reduce taxes for small and medium sized companies and also give them other incentives to create more jobs and invest in the future growth of their businesses.
Government Spending in GDP Formula
The government spending component measures all public expenditures. In the United States, this is the second largest category in GDP, after household Consumption, and contributes $3,814 billion to the American economy.
When we discuss how statisticians calculate the components of GDP, it is worth noting that it is the only component that is directly controlled by the government. Obviously, the policymakers can promote higher household spending, by increasing the amount of standard deduction of its citizens or giving them other types of tax cuts. The government can also reduce taxes for businesses or give them other incentives to increase investment.
However, it is obvious that the government can not intervene to the extent to set household or business spending himself. Yet, despite this limitation, the policymakers can raise or reduce their spending levels in order to stabilize the economy.
This is why during the 2008 great recession, many governments across the globe have decided to raise their expenditures considerably. The main idea behind those decisions was the fact that faced with collapsing consumer confidence and lower household expenditure, governments could offset those losses by raising their own spending levels.
Obviously, there is no guarantee that the policymakers will be in a position to neutralize all of the losses to the economy. However, if they manage to offset at least some of the decline, then this can certainly help the country to avoid experiencing a prolonged period of economic downturn.
The need for such intervention during economically challenging times seems quite logical and can certainly help the country to recover from the recession. However, here it is important to note that this policy does have its limitations as well. If the government wants to spend the larger amount then its revenues, it has to either borrow or print the difference.
It goes without saying that each of those options does have its own downsides and risks. Borrowing large amounts of money is something that nearly all developed countries are doing.
The basic scheme behind this is very simple. The government issues bonds and sells them at the market. If the duration of this security is short, 1 year or less, then the investor buys treasury bills at a discount and receives its original investment along with some interest at the end of the term.
In the case of the long term bonds, the government typically pays an interest, also known as a coupon to investors with the 6-month intervals and it also repays the principal once the term expires.
Now, the problem here with the out of control borrowing is very clear. Firstly, as the government issues more bonds, its interest expenses also rise considerably, consuming the larger portion from its overall revenues. In the long term, this becomes unsustainable, because at some point the government will not be in a position to pay for its military, cover medicare, welfare, and other commitments.
There is also the risk that if the government spending gets out of control, the bond investors might start to lose confidence and demand higher interest rates to lend money to the government. As a result, the bond yields might rise to such levels that the public finances might not sustain this. This is essentially how the crisis in the Eurozone developed.
The other option which includes money printing has its fair share of risks and potential problems. The massive amount of money printing can lead to a significant amount of devaluation of the currency and can significantly reduce the standard of living in a given country.
Therefore, government spending can be a useful tool to stabilize the economy. However, it must be used with great caution and moderation.
Effects on GDP by Net Export
The Net Exports component measures the difference between the total exports and imports in the given country. Obviously, in this case, we can have two distinct scenarios. If the total imports exceed the amount of the total exports. In this case, it is said that the economy is running a trade deficit. As a result, the amount of this deficit will be subtracted from GDP. For example, during 2019, the US will run a trade deficit of $578 billion. This means that the Net Exports category has reduced the overall size of the US GDP by $578 billion.
On the other hand, if the total number of exports are greater than imports, then the economists call this the trade surplus. The actual size of the trade surplus is added to the GDP. Therefore, if a given country manages to reduce its trade deficit or even move into surplus territory, then it can improve its economic growth rate considerably.
Here it is also worth noting that this can also have an added benefit of promoting the appreciation of the country’s currency. This is because when a nation’s goods and services are highly competitive, this also creates a natural demand for the country’s currency as well. This can certainly strengthen the currency in question and help it to appreciate against some of its peers.
What is the Real Gross Domestic Product?
It goes without saying that nominal GDP, as we have described above, can be very informative of the economic performance of the given country. However, this measure has its own imperfections as well.
One of the drawbacks of nominal GDP is the fact that it measures the total value of goods and services in raw dollar amounts, without any consideration for the inflationary dynamics in a given country. Therefore, the nominal GDP might not be helpful for getting a clear picture of the economic performance of the country. For example, a nation has a 6% nominal economic growth, might seem very decent, but if the inflation rate is running at 8%, then the economy has contracted by 2% and is in a recession, which is not that impressive.

This is exactly where the real GDP comes into play. It subtracts the inflation rate from the overall rate of economic growth. This is usually achieved by choosing the base year and measuring all GDP amounts in so-called ‘constant dollars’. This means that during all subsequent years, the nominal GDP amounts are adjusted according to inflation. For example, if a nation has a nominal GDP growth rate of 6% and the inflation rate stands at 3%, then the real GDP growth rate will be 3%.
Here it is important to take note of the fact that the rate at which statisticians adjust the GDP according to inflation is not the popular Consumer Price Index (CPI), instead, they use the other measure, called ‘deflator’. The main difference between those two indicators is the fact that the CPI does include imported products as well. On the other hand, since GDP only measures domestically produced goods and services, the deflator determines the actual amount of inflation with locally produced products.
Here it is worth noting that the components of real GDP are the same as the nominal GDP, so the difference between those is not in terms of their composition. So the main principle here is that the amount of GDP is simply adjusted according to the deflator.
In many cases, the difference between CPI and deflator is quite small and usually, they tend to move in the same direction. However, depending on the economic circumstances, they can diverge from each other significantly at times.
Due to the fact that the real GDP represents a more accurate picture of the economic performance of the given country, it tends to have a more notable impact on the exchange rate movements.
GDP per Capita
Another imperfection of the nominal GDP indicator is the fact that it does not take account of the population of the given country. Therefore, when it comes to measuring the relative living standards between different nations, the nominal GDP might not be the most accurate indicator.
To address this imperfection, we have the GDP per capita indicator. What it does is that it essentially divides the GDP figure to the number of the population of the given country. In this way, one can find out the total value of the goods and services produced within a given nation for a year per citizen.
This is why the GDP per capita is one of the most popular indicators for measuring the relative living standards between two given countries.
Influence of GDP Growth Rates on Exchange Rates
At this point, many traders might wonder what if any influence does the GDP growth rates have over the Forex market. Well, if we take a look at the past experience, it is obvious that economic strength is a major factor driving the exchange rates.
On the one hand, it is worth noting that central banks across the world usually target the inflation rate. There were some proposals for this, but so far no major central bank has adopted any target for GDP growth rates. However, this does not change the fact that policymakers do take a decent amount of attention to the latest Gross Domestic Product figures.
The reason for this is the fact that the weakening economy can very often lead to very low inflation or to deflation as well. On the other hand, when a country has a very strong GDP growth rate, it can also have inflation rates much higher than before.
Consequently, the latest economic growth dynamics can have a major impact on the exchange rates of different currency pairs. To illustrate, let us take a look at this daily EUR/USD chart:
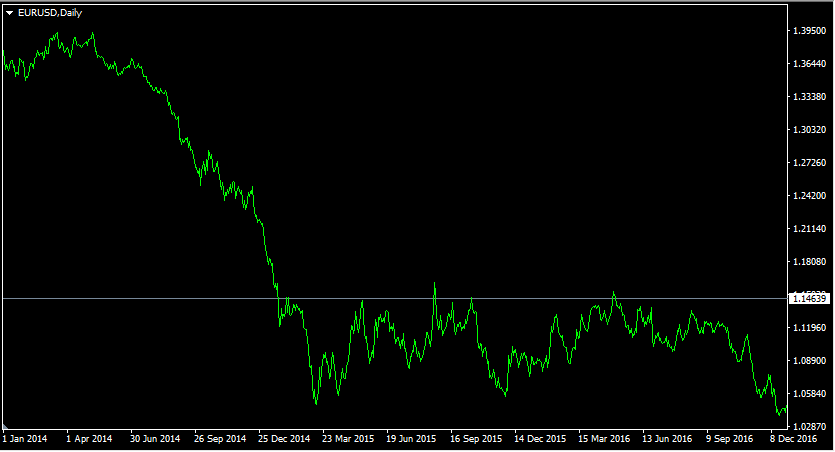
As we can see from the diagram above, the pair traded at $1.37 at the beginning of the year 2014. During the subsequent month, the single currency made some additional gains, rising to $1.39 during May 2014. Some financial commentators have predicted the further appreciation of the Euro, with the single currency breaking above the psychologically important $1.40 level and perhaps going as far as $1.50.
However, there was one factor that worked against the strength of the European currency. Mostly due to the ongoing EU Sovereign debt crisis, the economic growth in the region was very weak. From 2012 to 2013, the Eurozone fell into recession. From 2014, the region did manage to return its GDP growth rate to positive territory. However, for this and all of the subsequent years, the growth rate was lower than 1%.
Due to the overall weakness of the economy, the European Central Bank cut its key interest rate repeatedly, eventually even reducing it to 0%. In addition to this measure, the European policymakers also turned to quantitative easing as a part of the solution. This did help to temporarily boost the inflation rate, but it made very little difference in terms of economic growth.
This was in sharp contrast to the US economy, which achieved a real GDP growth rate of 2.5% during 2014, followed by a 2.9% increase in 2015. The inflation rates also increased notably. As a result of those developments, the US Federal Reserve has authorized the first rate hike in a decade by December 2015. This was followed by a number of further increases, as a result of which the Federal Funds Rate has risen up to 2.5% by the end of 2018.
As we can see from this chart, those economic growth differentials, as well as the divergence of policy had a significant effect on the exchange rates. From the second half of May 2014, the EUR/USD exchange rate fell consistently, eventually going all the way down to $1.05 by March 2016. During the subsequent years, the pair stabilized and settled to $1.05 to $1.15 range. So the scale of the decline of the Euro during this period in percentage terms was approximately 24.5%.
Example of GBP/USD
The EUR/USD was not the only pair that was influenced by the relative economic growth differentials. In fact, we have a very similar situation with the GBP/USD pair as well. In order to visualize this better, let us take a look at this daily GBP/USD chart:
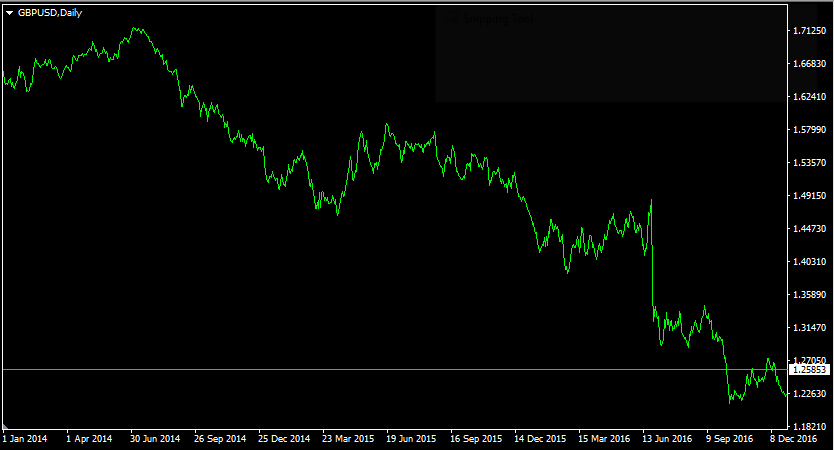
The above diagram demonstrates that at the beginning of 2014 the pound traded at $1.63 level. During the following months, the British currency has made some additional gains, eventually going above $1.71 level during July 2014.
However, this show of strength turned out to be quite temporary. After this development, the pound entered into the long term downward trend, eventually dropping all the way down to $1.22 level by December 2016.
One of the likely reasons for this turn of events was the economic growth differentials between the US and the UK. The UK economic growth already started to fall behind, compared to the US during 2015. However, this difference became especially apparent during the subsequent years. For example, by 2018, the United States had a real GDP growth of 2.9%, while in the case of the United Kingdom, this number stood at 1.4%.
It goes without saying that the outcome of the UK European Union membership referendum had played an important role in the depreciation of the pound. However, it is important to take note of the fact that this event took place during June 2016, when the long term decline of GBP/USD was already underway from August 2014.
Guide to GDP and Its Components
- The Gross Domestic Product, also known as GDP is one of the most important indicators of the economic strength of a given country. It measures the total value of goods and services produced within a given nation during the specific year. Besides the nominal GDP, there are also two additional measures. Real GDP adjusts the nominal figures to inflation, therefore it is a key indicator for measuring real economic growth. At the same time, GDP per capita divides GDP figures to the size of the population of a given country.
- GDP has 4 key components: the Consumption, the Investment, the Government Spending, and Net Exports. The Consumption measures the total amount of household spending. The Investment essentially represents the capital expenditure by businesses. The Government Spending component measures the total amount of public spending. Finally, the Net Exports category calculates the balance between the total amount of exports and imports within the economy.
- Each of the four components of GDP has its own specific characteristics. Consumption is the largest component of the GDP and even the smallest changes in consumer spending can have a notable impact on economic growth. The increasing investment can boost the productivity of the economy. The governments often adjust the amount of their spending in order to stabilize the economy, however, this policy tool has its own limits as well. Finally, the Net Exports category can be represented by negative numbers as well, in which case it tends to reduce the overall GDP level.